Unlock the Secrets of Statistics and Probability with Expert Guidance and Real-World Application
Suppose that each student in a sample had been categorized with respect to political views, marijuana usage, and religious preference, with the categories of this latter factor being Protestant, Catholic, and other. The data could be displayed in three different two-way tables, one corresponding to each category of the third factor.

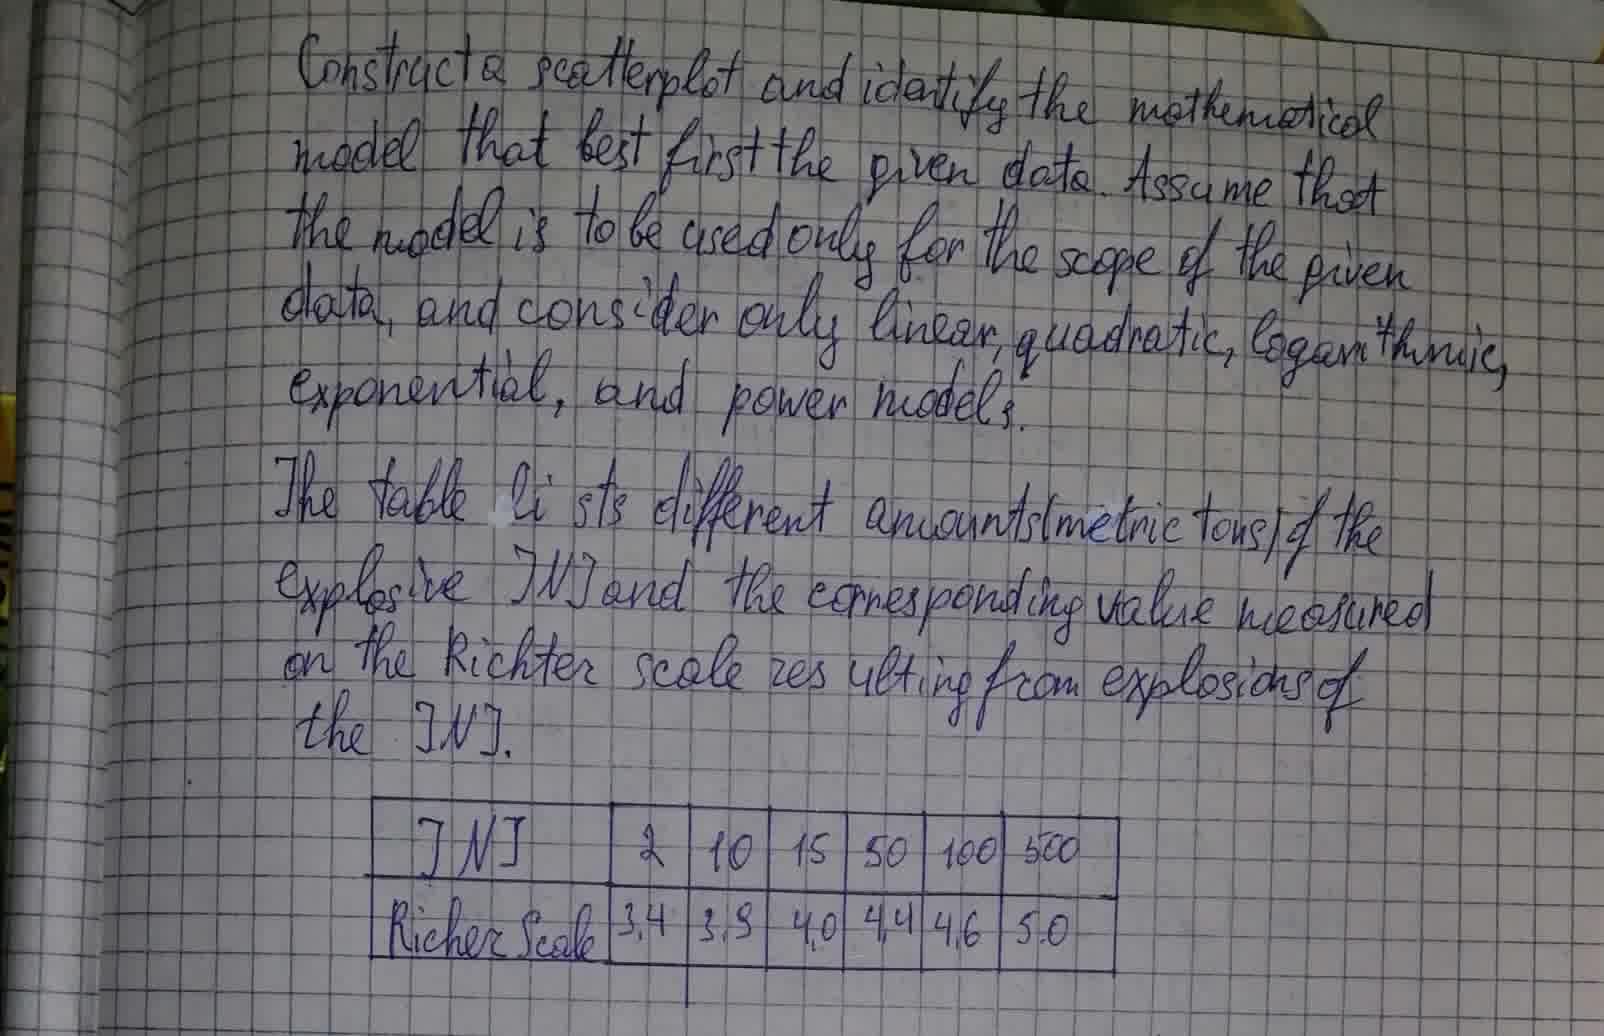
Construct a scatterplot and identify the
mathematical model that best fits the given data.
This exercise concern time series. a. obtain a scatterplot for the data. b. find and interpret the regression equation. c. make the specified forecasts. Is there evidence of global warming in the records of ice cover on lakes?

Make a scatterplot for the data in the table below.
Height (in.): 77 75 76 70 70 73 74 74 73
Weight (lb): 230 220 212 190 201 245 218 260 196

Height (in.): 77 75 76 70 70 73 74 74 73
Weight (lb): 230 220 212 190 201 245 218 260 196
Researchers carried our a survey of fourth-, fifth-, and sixth-grade students in Michigan. Students were asked if good grades, athletic ability, or being popular was most important to them. The two-way table summarizes the survey data.

Make a scatterplot of the data with two new points added. Point A: 10% return, 25 new birds. Point B: 40% return, 5 new birds. Find two new correlations: for the original data plus Point A and for the original data plus Point B.

Study the scatterplots and rank correlations displayed in your classroom

Graph the following data on a scatterplot. a. Does the graph show either a positive or a negative association? b. Does there appear to be a connection between height and spelling ability? c. Does greater height cause better spelling ability? d. What other factors could create the association you see?

Construct a scatterplot and identify the mathematical model that best fits the given data.

Construct a scatterplot and identify the mathematical model that best fits the given data.
"It is right to use animals for medical testing if it might save human lives." The General Social Survey asked 1152 adults to react to this statement Here is the two-way table of their responses:

Sketch a scatterplot showing data for which the correlation is r = -1.

HOW can you use technology to describe associations in scatter plots?
When two targets are presented close together in a rapid visual stream, the second target is often missed. Psychologists call this phenomenon the attentional blink (AB). A study published in Advances in Cognitive Psychology (July 2013) investigated whether simultaneous or preceding sounds could reduce AB. Twenty subjects were presented a rapid visual stream of symbols and letters on a computer screen and asked to identify the first and second letters (the targets). After several trials, the subject's AB magnitude was measured as the difference between the percentages of first target and second target letters correctly identified. Each subject performed the task under each of three conditions. In the Simultaneous condition, a sound (tone) was presented simultaneously with the second target; in the Alert condition, a sound was presented prior to the coming of the second target; and in the No-Tone condition, no sound was presented with the second target. Scatterplots of AB magnitude for each possible pair of conditions are shown below as well as the least squares line for each.
a. Which pair of conditions produces the least squares line with the steepest estimated slope?
b. Which pair of conditions produces the least squares line with the largest SSE?
c. Which pair of conditions produces the least squares line with the smallest estimate of
How can you use a scatterplot to describe the relationship between two data sets?
One bushel of apples from a dwarf apple tree is equal to 42 pounds. Write an expression to find the number of pounds of apples in any number of bushels. If one tree can produce 6 bushels, how many pounds of apples will an orchard of 100 trees produce?
The _______ relative frequencies are the sums of each row and column in a two-way table. (joint, marginal, or conditional)
Do men and women differ in their attitudes toward public corruption and tax evasion? This was the question of interest in a study published in Contemporary Economic Policy (Oct. 2010). The data for the analysis were obtained from a representative sample of over 30,000 Europeans. Each person was asked how justifiable it is for someone to (1) accept a bribe in the course of their duties and (2) cheat on their taxes. Responses were measured as 0, 1, 2, or 3, where O = "always justified" and 3 = "never justified." The large-sample Wilcoxon rank sum test was applied in order to compare the response distributions of men and women.
a. Give the null hypothesis for the test in the words of the problem.
b. An analysis of the "justifiability of corruption" responses yielded a large-sample test statistic of
c. Refer to part b. Women had a larger rank sum statistic than men. What does this imply about gender attitudes. toward corruption?
d. An analysis of the "justifiability of tax evasion" responses yielded a large-sample test statistic of
e. Refer to part d. Again, women had a larger rank sum statistic than men. What does this imply about gender attitudes toward tax evasion?
If there is a 25% chance that it will rain on any given day in Seattle, find the probability that it will rain for three consecutive days.
What do you notice about the value that always falls in the cell to the lower right of a two-way table when marginal relative frequencies have been written in? What does this value represent?
Make a scatterplot of the data. Use 87 for 1987
.
Make a scatterplot of the data. Use 87 for 1987
.