Scatter Plots Explained
Recent questions in Scatterplots
High school statisticsAnswered question
Make a scatterplot that shows a strong relationship between two variables but a low correlation.
High school statisticsAnswered question
Describe the shape of a scatter plot that suggests modeling the data with a logarithmic function.
High school statisticsAnswered question
Regarding a scatterplot,
a) identify one of its uses.
b) what property should it have to obtain a regression line for the data?
a) identify one of its uses.
b) what property should it have to obtain a regression line for the data?
High school statisticsAnswered question
Make a scatterplot of the data. Use 87 for 1987.
Make a scatterplot of the data. Use 87 for 1987.
High school statisticsAnswered question
Using the daily high and low temperature readings at Chicagos
High school statisticsAnswered question
Tom is creating a scatterplot that depicts the perimeter and area of a square. (If s is the length of a side of a square, the perimeter is 4s and the area is s2). He sets up these coordinates in which the explanatory variable is the perimeter and the response variable is the area. (10, u) (12, v) (20, w) (24, x) (36, y) (z, 49) a. Find the values of u, v, w, x, y, and z. b. If the points are put on a scatterplot, do they depict a positive or negative correlation?
High school statisticsAnswered question
The _ is always plotted on the y-axis of a scatterplot.
High school statisticsAnswered question
Is it possible for a linear regression line to go through every point on the scatterplot? Is it possible for a linear regression line to not go through any point on the scatterplot?
High school statisticsAnswered question
Graph the following data on a scatterplot. a. Does the graph show either a positive or a negative association? b. Does there appear to be a connection between height and spelling ability? c. Does greater height cause better spelling ability? d. What other factors could create the association you see?
Graph the following data on a scatterplot. a. Does the graph show either a positive or a negative association? b. Does there appear to be a connection between height and spelling ability? c. Does greater height cause better spelling ability? d. What other factors could create the association you see?
High school statisticsAnswered question
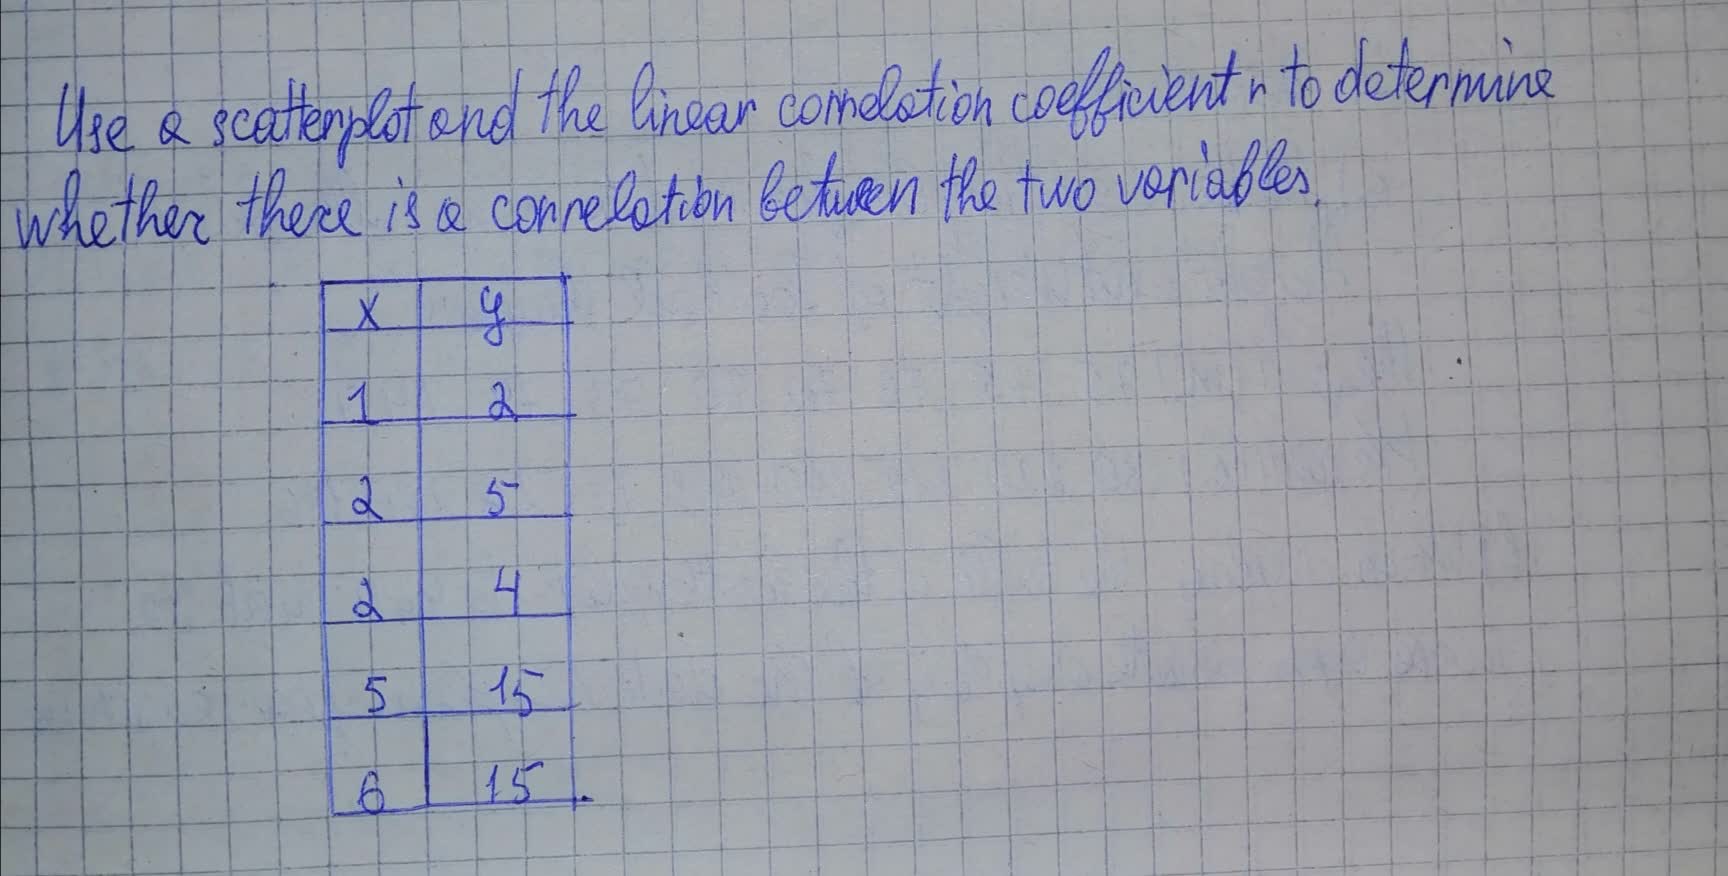
Use a scatterplot and the linear correlation coefficient r to determine whether there is a correlation between the two variables
High school statisticsAnswered question
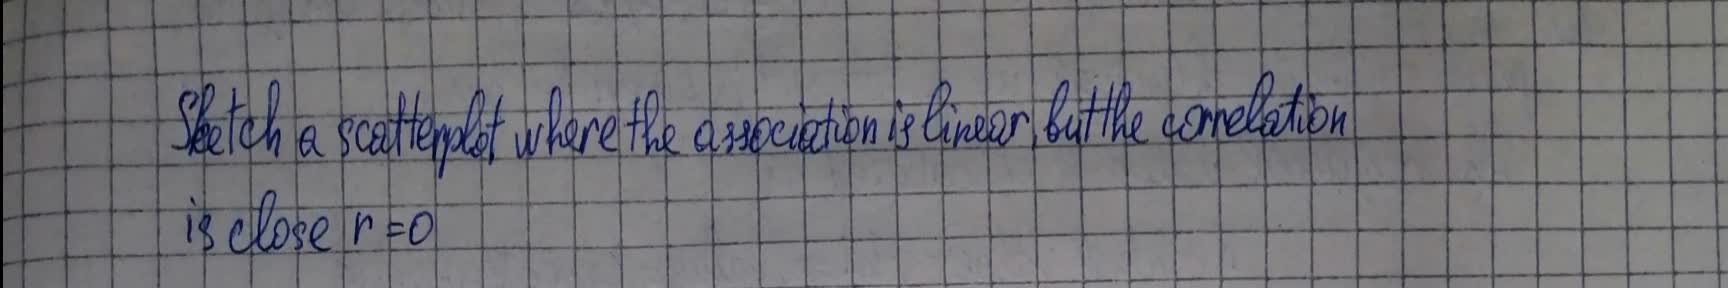
Sketch a scatterplot where the association is linear, but the correlation is close to r = 0.
High school statisticsAnswered question
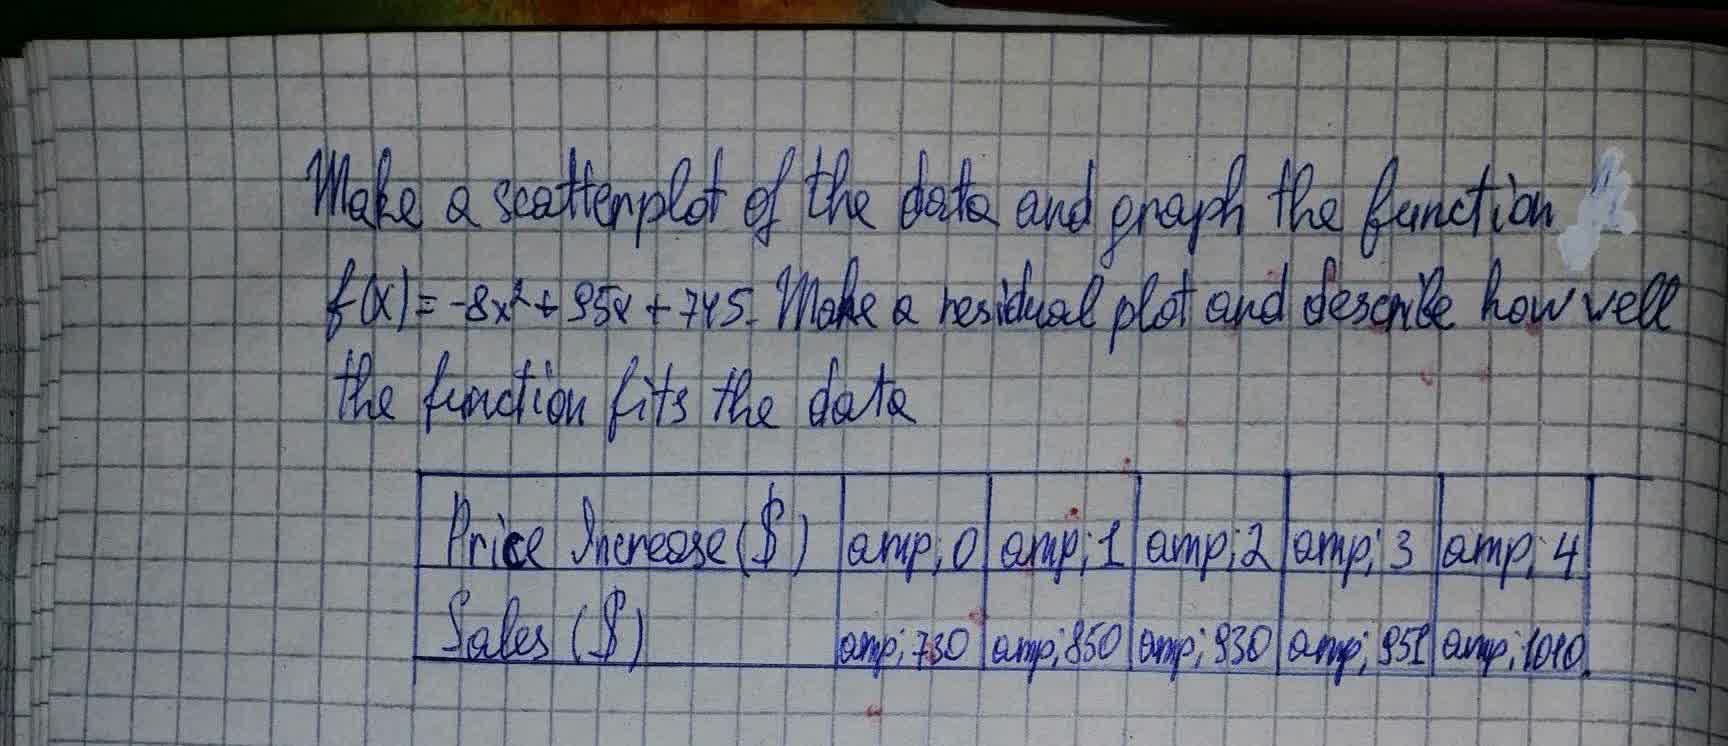
Make a scatterplot of the data and graph the function
High school statisticsAnswered question
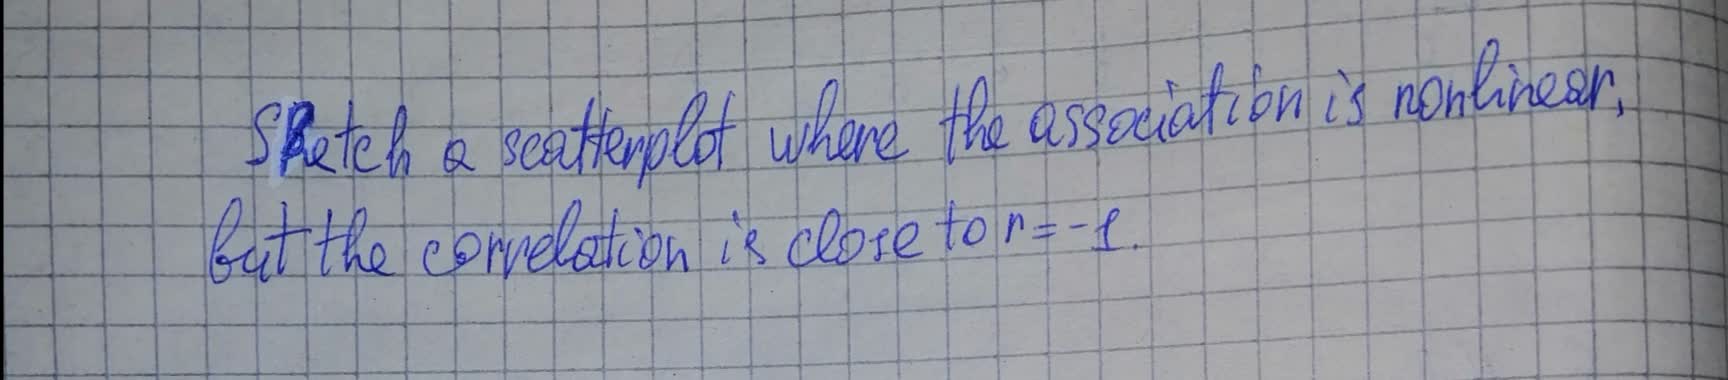
Sketch a scatterplot where the association is nonlinear, but the correlation is close to r = -1.
High school statisticsAnswered question
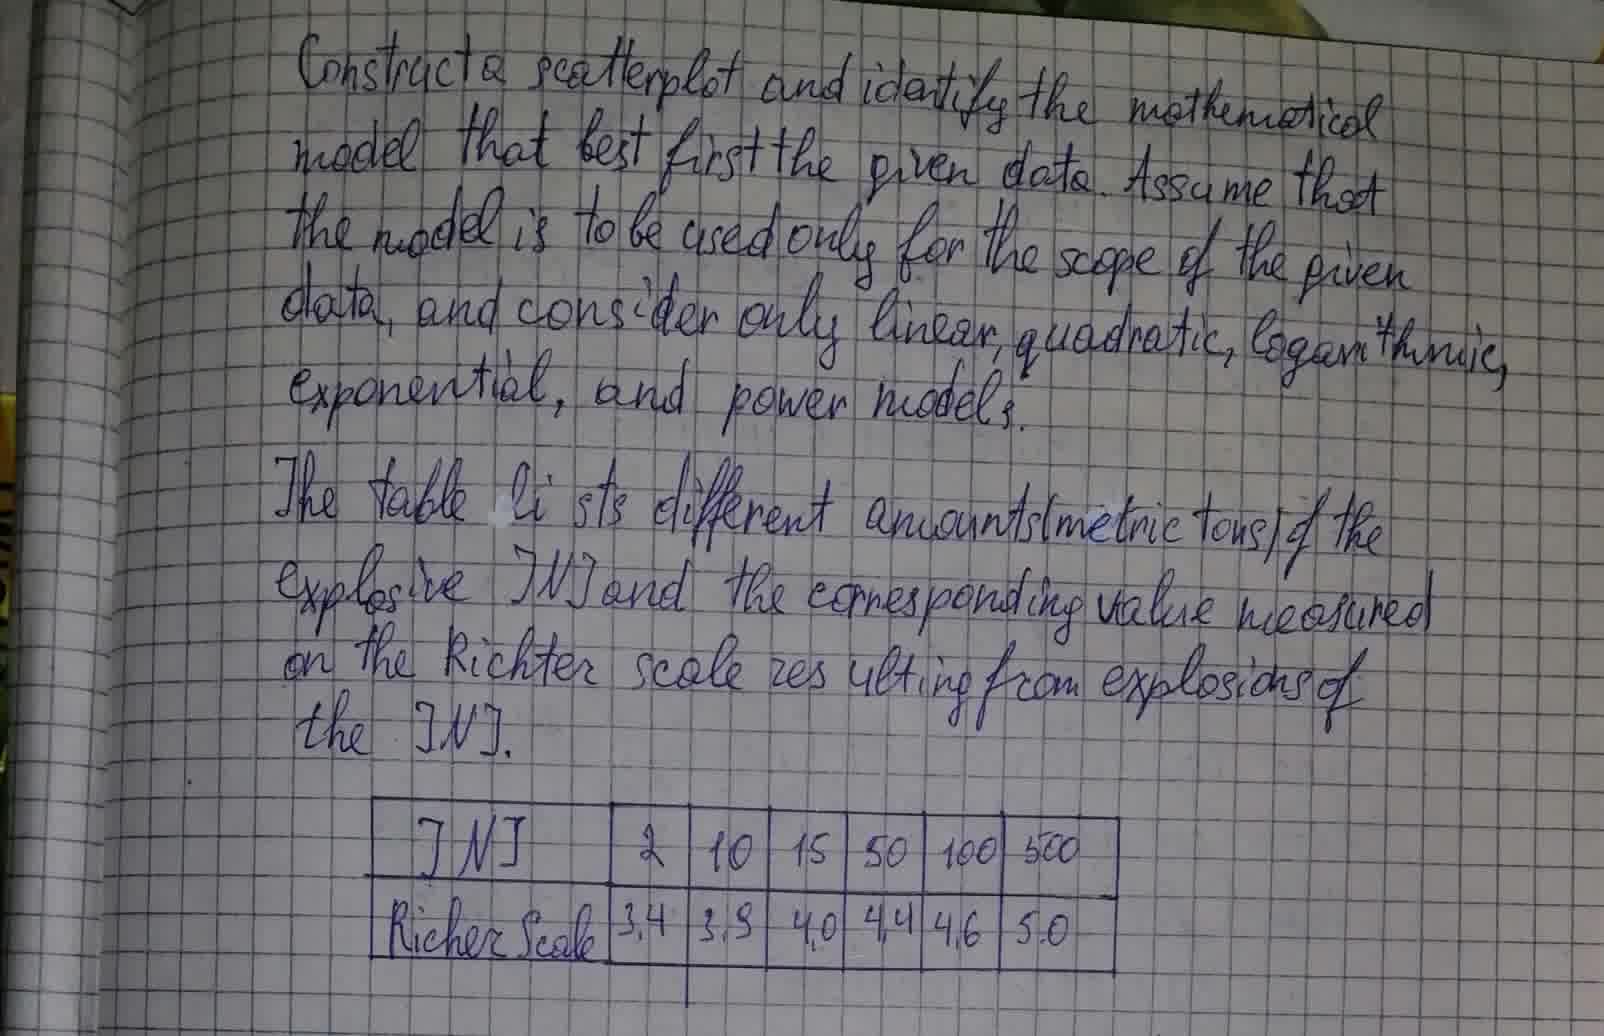
Construct a scatterplot and identify the
mathematical model that best fits the given data.
High school statisticsAnswered question
This exercise concern time series. a. obtain a scatterplot for the data. b. find and interpret the regression equation. c. make the specified forecasts. Is there evidence of global warming in the records of ice cover on lakes?

High school statisticsAnswered question
Make a scatterplot for the data in the table below.
Height (in.): 77 75 76 70 70 73 74 74 73
Weight (lb): 230 220 212 190 201 245 218 260 196

Height (in.): 77 75 76 70 70 73 74 74 73
Weight (lb): 230 220 212 190 201 245 218 260 196
High school statisticsAnswered question
Study the scatterplots and rank correlations displayed in your classroom


The majority of scatter plots questions that you will find are related to the subject of statistics and probability that seem more complex than they seem. Although these can be studied during the high school curriculum, it's virtually impossible to find solutions that will work. Keeping this fact in mind, you use scatter plots to build horizontal and vertical axes to determine the effect between the variables. Always use scatter plots equations when you work with the markers as it will help you to save time and provide more accuracy with the graphics before you continue with the word problems.