Find the expected count and the contribution to
Leah Vasquez
Answered question
2022-06-19
Find the expected count and the contribution to the chi-square statistic for the (Group 1, No) cell in the two-way table below.
| Yes | No | Total | |
| Group 1 | 56 | 44 | 100 |
| Group 2 | 135 | 65 | 200 |
| Group 3 | 67 | 26 | 93 |
| Total | 258 | 135 | 393 |
Round your answer for the expected count to one decimal place, and your answer for the contribution to the chi-square statistic to three decimal places.
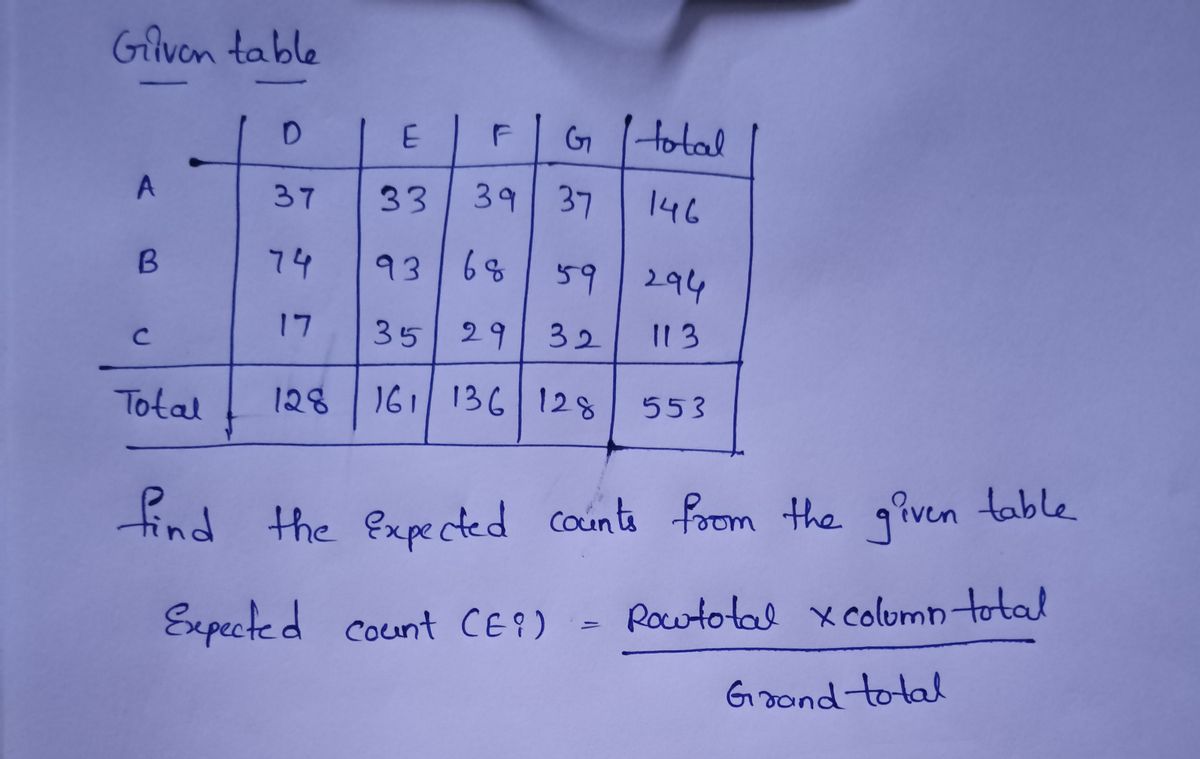
Find the expected count and the contribution to the chi-square statistic for the (C,D)
cell in the two-way table below.
| D | E | F | G | Total | |
| A | 37 | 33 | 39 | 37 | 146 |
| B | 74 | 93 | 68 | 59 | 294 |
| C | 17 | 35 | 29 | 32 | 113 |
| Total | 128 | 161 | 136 | 128 | 553 |
Round your answer for the expected count to one decimal place, and your answer for the contribution to the chi-square statistic to three decimal places.
Find the expected count and the contribution to the chi-square statistic for the (Treatment, Strongly Disagree) cell in the two-way table below.
| Strongly Agree | Agree | Neutral | Disagree | Strongly Disagree | |
| Control | 39 | 47 | 5 | 15 | 11 |
| Treatment | 60 | 46 | 11 | 3 | 1 |
Round your answer for the excepted count to one decimal place, and your answer for the contribution to the chi-square statistic to three decimal places.
Find the expected count and the contribution to the chi-square statistic for the (Group 1, No) cell in the two-way table below.
| Yes | No | |
| Group 1 | 739 | 262 |
| Group 2 | 1155 | 319 |
Round your answer for the excepted count to one decimal place, and your answer for the contribution to the chi-square statistic to three decimal places.
Give the degrees of freedom for the chi-square test based on the two-way table.
| Yes | No | Total | |
| Group 1 | 56 | 44 | 100 |
| Group 2 | 132 | 68 | 200 |
| Group 3 | 72 | 28 | 100 |
| Total | 260 | 140 | 400 |
Consider the data with analysis shown in the following computer output:
| Level | N | Mean | StDev |
|---|---|---|---|
| A | 6 | 10.100 | 2.882 |
| B | 5 | 16.800 | 2.168 |
| C | 4 | 10.800 | 2.387 |
| Source | DF | SS | MS | F | P |
|---|---|---|---|---|---|
| Groups | 2 | 138.60 | 69.30 | 10.74 | 0.002 |
| Error | 12 | 77.42 | 6.45 | ||
| Total | 14 | 216.02 |
What is the pooled standard deviation? What degrees of freedom are used in doing inferences for these means and differences in means?
Round your answer for the pooled standard deviation to two decimal places.
Consider the data with analysis shown in the following computer output:
| Level | N | Mean | StDev |
|---|---|---|---|
| A | 5 | 86.950 | 5.002 |
| B | 5 | 76.167 | 6.555 |
| C | 7 | 80.000 | 9.230 |
| D | 7 | 69.333 | 6.154 |
| Source | DF | SS | MS | F | P |
|---|---|---|---|---|---|
| Groups | 3 | 973.93 | 324.64 | 6.43 | 0.003 |
| Error | 20 | 1010.34 | 50.52 | ||
| Total | 23 | 1984.27 |
What is the pooled standard deviation? What degrees of freedom are used in doing inferences for these means and differences in means?
Round your answer for the pooled standard deviation to two decimal places
Use the following ANOVA table for regression to answer the questions.
Analysis of Variance
| Source | DF | SS | MS | F | P |
|---|---|---|---|---|---|
| Regression | 1 | 286.6 | 286.6 | 1.85 | 0.176 |
| Residual Error | 174 | 26952.6 | 154.9 | ||
| Total | 175 | 27239.2 |
Give the F-statistic and p-value.
Enter the exact answers.
Use the following ANOVA table for regression to answer the questions.
Analysis of Variance
| Source | DF | SS | MS | F | P |
|---|---|---|---|---|---|
| Regression | 1 | 3401.4 | 3401.4 | 19.6 | 0.000 |
| Residual Error | 174 | 30189.0 | 173.5 | ||
| Total | 175 | 33590.4 |
Give the F-statistic and p-value.
Use the following ANOVA table for regression to answer the questions.
Response: Y
| Source | DF | Sum Sq | Mean Sq | F-value | Pr(>F) |
|---|---|---|---|---|---|
| Regression | 1 | 347.95 | 347.95 | 13.27 | 0.000 |
| Residual Error | 359 | 9412.98 | 26.22 | ||
| Total | 360 | 9760.93 |
Give the F-statistic and p-value.
Use the following ANOVA table for regression to answer the questions.
Response: Y
| Source | DF | Sum Sq | Mean Sq | F-value | Pr(>F) |
|---|---|---|---|---|---|
| Regression | 1 | 10.756 | 10.756 | 2.89 | 0.090 |
| Residual Error | 342 | 1272.924 | 3.722 | ||
| Total | 343 | 1283.680 |
Give the F-statistic and p-value.
Enter the exact answers.
Two intervals are given, A and B, for the same value of the explanatory variable.
| A: 99 to 115 ; | B: 92 to 122 ; |
(a) Which interval is the confidence interval for the mean response?
Choose the answer from the menu in accordance to item (a) of the question statement
Which interval is the prediction interval for the response?
Choose the answer from the menu in accordance to item (a) of the question statement
(b) What is the predicted value of the response variable for this value of the explanatory variable?
Enter the exact answer.
Two intervals are given, A and B, for the same value of the explanatory variable.
| A: 10 to 12 ; | B: 4 to 18 ; |
(a) Which interval is the confidence interval for the mean response?
Choose the answer from the menu in accordance to item (a) of the question statement
Which interval is the prediction interval for the response?
Choose the answer from the menu in accordance to item (a) of the question statement
(b) What is the predicted value of the response variable for this value of the explanatory variable?
Enter the exact answer.
Two intervals are given, A and B, for the same value of the explanatory variable.
| A: 3.9 to 7.5 ; | B: 4.4 to 7.0 ; |
(a) Which interval is the confidence interval for the mean response?
Choose the answer from the menu in accordance to item (a) of the question statement
Which interval is the prediction interval for the response?
Choose the answer from the menu in accordance to item (a) of the question statement
(b) What is the predicted value of the response variable for this value of the explanatory variable?
Enter the exact answer.
Two intervals are given, A and B, for the same value of the explanatory variable.
| A: 15.8 to 23.2 ; | B: 15.4 to 23.6 ; |
(a) Which interval is the confidence interval for the mean response?
Choose the answer from the menu in accordance to item (a) of the question statement
Which interval is the prediction interval for the response?
Choose the answer from the menu in accordance to item (a) of the question statement
(b) What is the predicted value of the response variable for this value of the explanatory variable?
Enter the exact answer.
Answer & Explanation
Ian Adams
Skilled2022-06-19Added 140 answers
Q2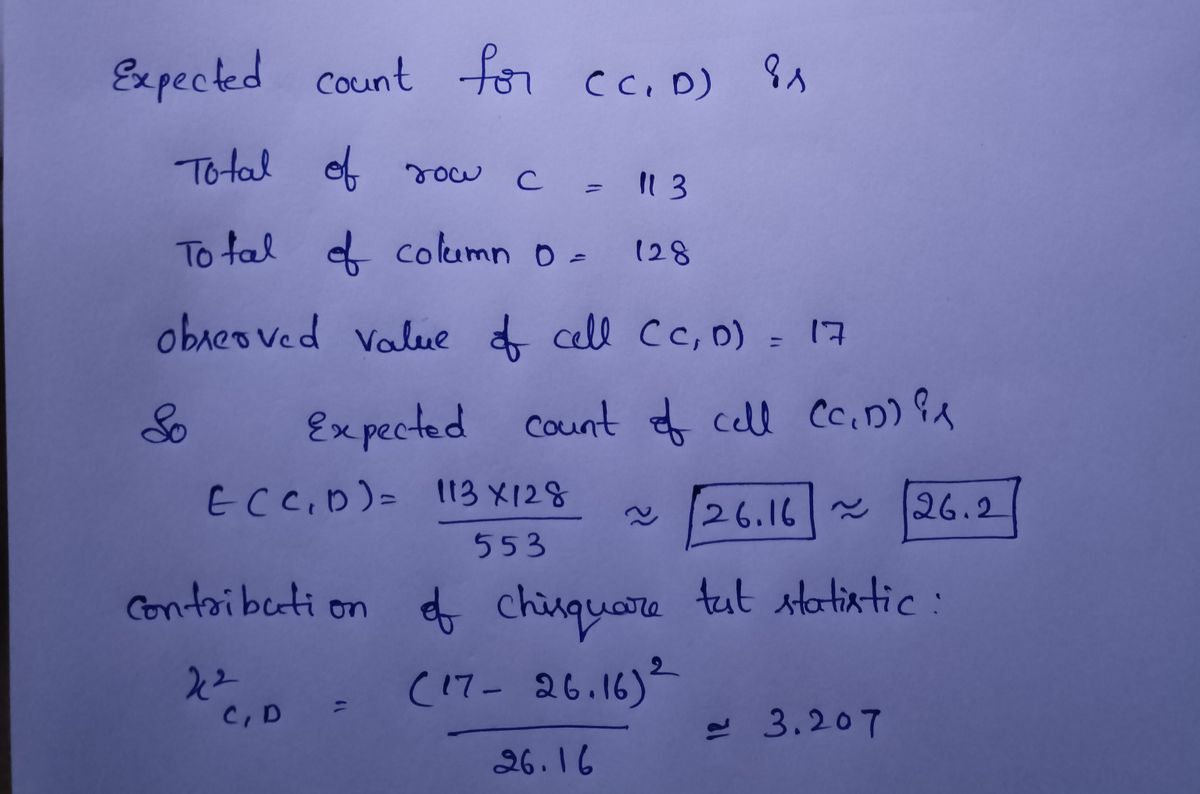
Ian Adams
Skilled2022-06-19Added 140 answers
Q4.There are two categorical variables which are group and opinion.
We have to find the expected count and the contribution to the chi-square statistic for the (Group 2, No) cell.
This is Chi-Square test for independence.
Ian Adams
Skilled2022-06-19Added 140 answers
Use the following ANOVA table for regression to answer the questions.
Response: Y
| Source | DF | Sum Sq | Mean Sq | F-value | Pr(>F) |
|---|---|---|---|---|---|
| Regression | 1 | 347.95 | 347.95 | 13.27 | 0.000 |
| Residual Error | 359 | 9412.98 | 26.22 | ||
| Total | 360 | 9760.93 |
Give the F-statistic and p-value.
Use the following ANOVA table for regression to answer the questions.
Response: Y
| Source | DF | Sum Sq | Mean Sq | F-value | Pr(>F) |
|---|---|---|---|---|---|
| Regression | 1 | 10.756 | 10.756 | 2.89 | 0.090 |
| Residual Error | 342 | 1272.924 | 3.722 | ||
| Total | 343 | 1283.680 |
Give the F-statistic and p-value.
Answer


Ian Adams
Skilled2022-06-19Added 140 answers
Use the following ANOVA table for regression to answer the questions.
Analysis of Variance
| Source | DF | SS | MS | F | P |
|---|---|---|---|---|---|
| Regression | 1 | 3401.4 | 3401.4 | 19.6 | 0.000 |
| Residual Error | 174 | 30189.0 | 173.5 | ||
| Total | 175 | 33590.4 |
Give the F-statistic and p-value.
Answer


Ian Adams
Skilled2022-06-19Added 140 answers
What is the pooled standard deviation? What degrees of freedom are used in doing inferences for these means and differences in means?
Round your answer for the pooled standard deviation to two decimal places.
Consider the data with analysis shown in the following computer output:
| Level | N | Mean | StDev |
|---|---|---|---|
| A | 5 | 86.950 | 5.002 |
| B | 5 | 76.167 | 6.555 |
| C | 7 | 80.000 | 9.230 |
| D | 7 | 69.333 | 6.154 |
| Source | DF | SS | MS | F | P |
|---|---|---|---|---|---|
| Groups | 3 | 973.93 | 324.64 | 6.43 | 0.003 |
| Error | 20 | 1010.34 | 50.52 | ||
| Total | 23 | 1984.27 |
Answer:

Ian Adams
Skilled2022-06-19Added 140 answers
Q1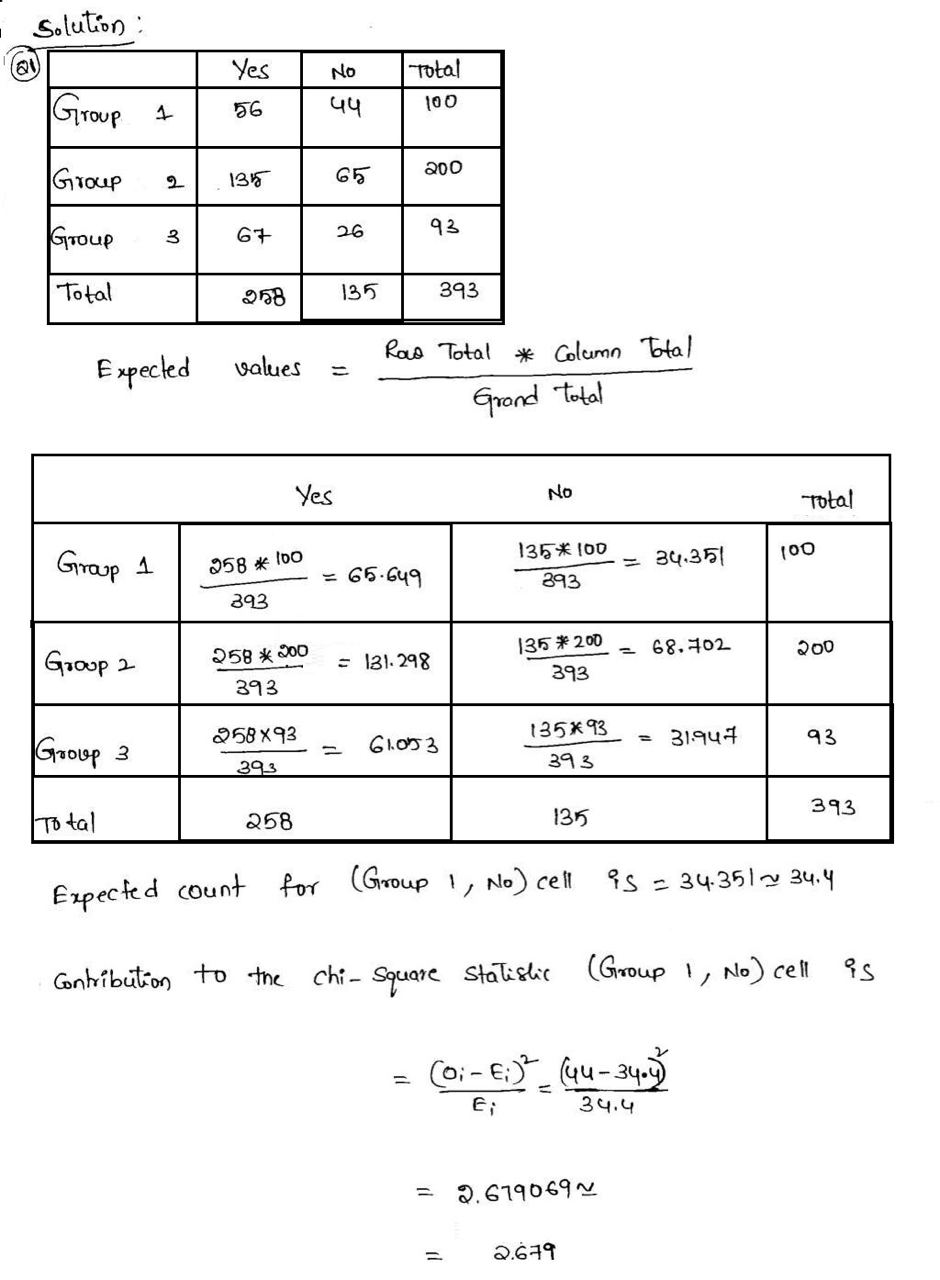
Ian Adams
Skilled2022-06-19Added 140 answers
Round your answer for the pooled standard deviation to two decimal places
Use the following ANOVA table for regression to answer the questions.
Analysis of Variance
| Source | DF | SS | MS | F | P |
|---|---|---|---|---|---|
| Regression | 1 | 286.6 | 286.6 | 1.85 | 0.176 |
| Residual Error | 174 | 26952.6 | 154.9 | ||
| Total | 175 | 27239.2 |
Give the F-statistic and p-value.
Answer:
It is given that
Mean sum of square of error is MSE = 154.9
The pooled standard deviation can be calculated as
Pooled SD = √(MSE) = √(154.9) = 12.45 (upto 2 decimal places)
From the given ANOVA table, the F-statistic is given by
F = 1.85
From the given ANOVA table the p-value is given by
P-value = 0.176
Ian Adams
Skilled2022-06-19Added 140 answers
Q3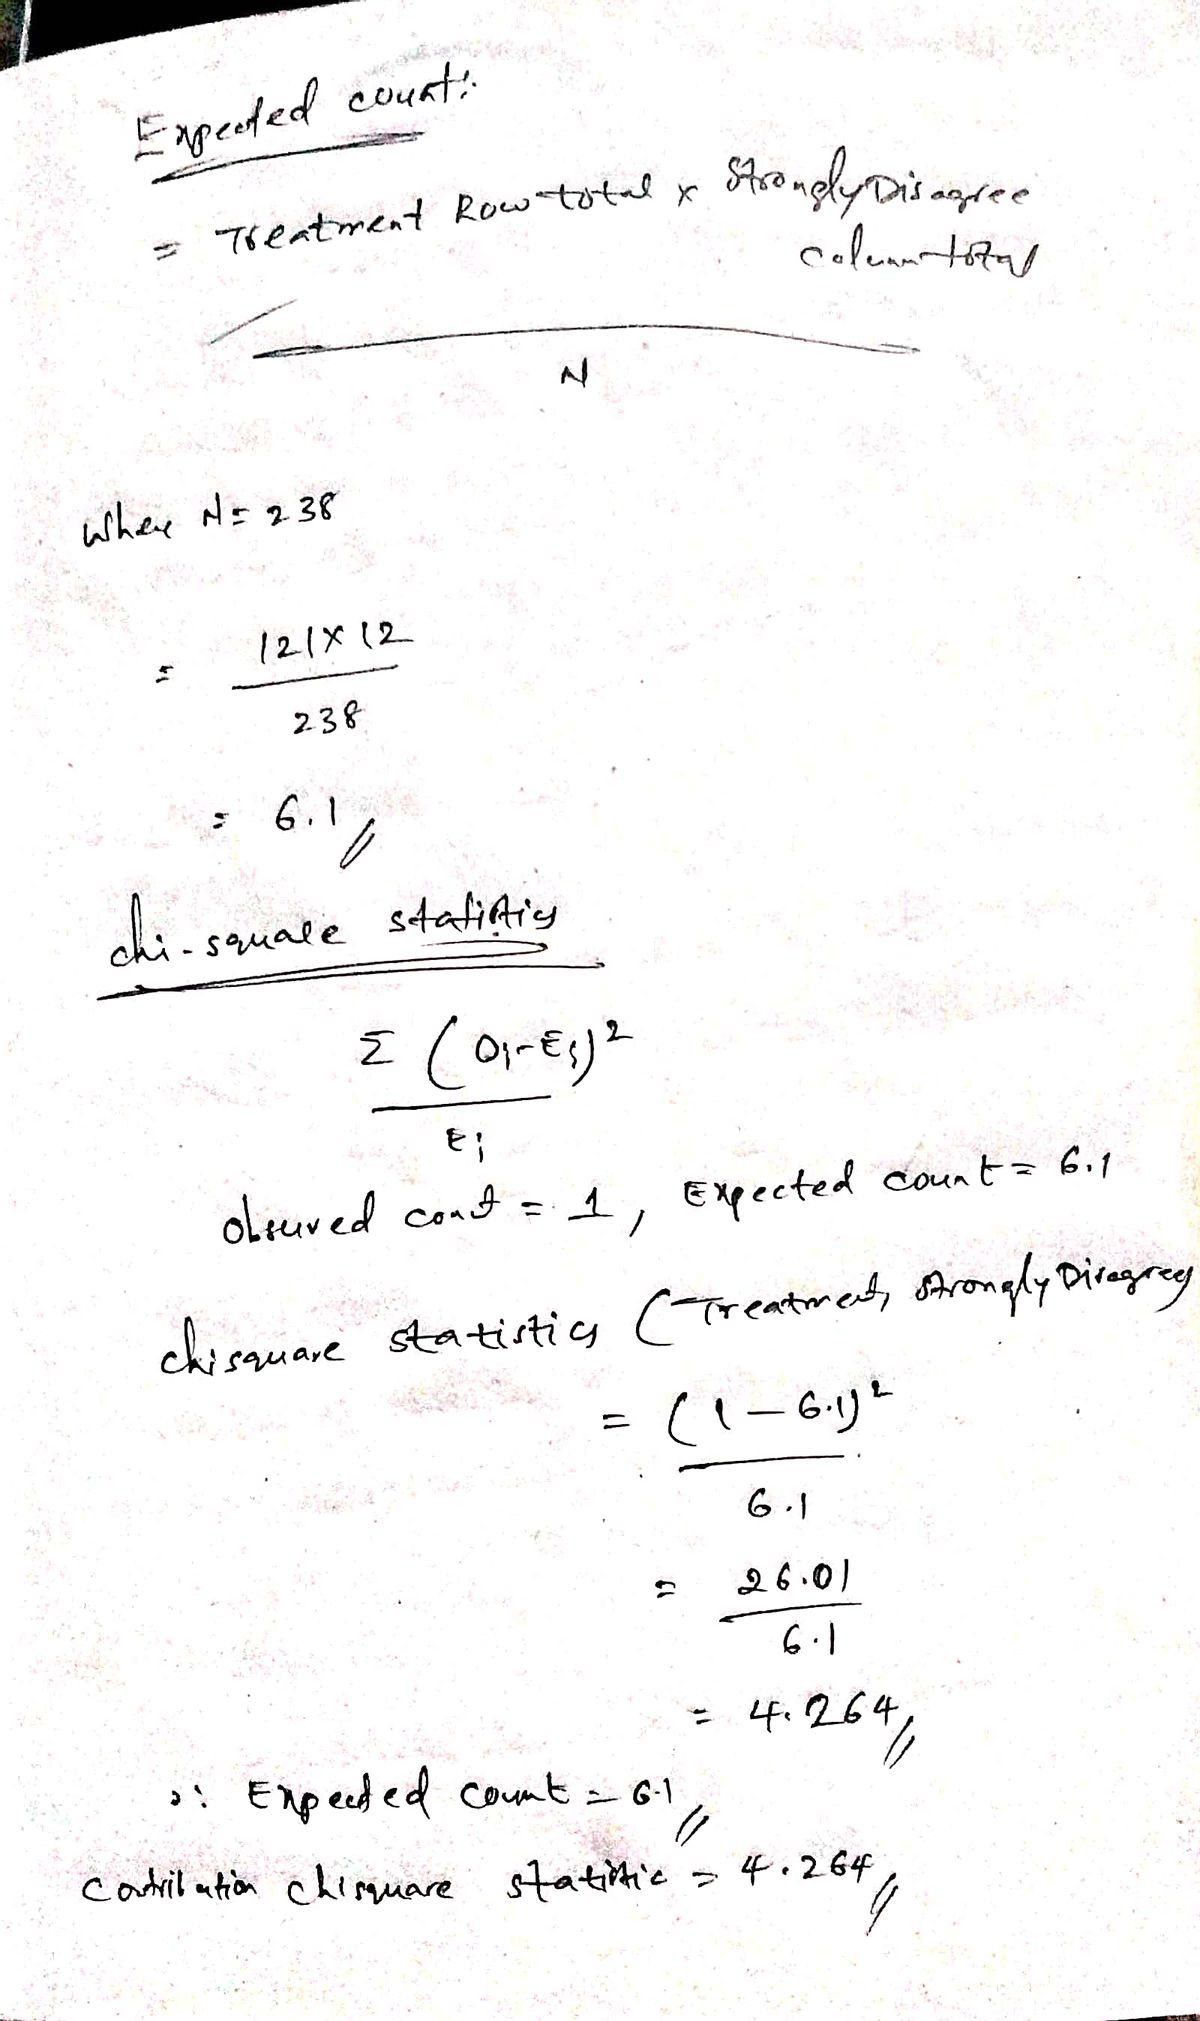
New Questions in Descriptive Statistics
What is the range of the function ?
The domain and range of is
A)
B)
C)
D)Mean of the squares of the deviations from mean is called the:
Variance
Standard deviation
Quartile deviation
ModeHow to evaluate P(10,2)?
What is the effect of wind speed on evaporation?
What is the range of a linear function?
Find the range of
State the main limitations of statistics.
What is the range of the function y = x?
Tell whether the statement is true or false : A data always has a mode.

In most cases,_____variables are not considered to be equal unless they are exactly the same.
A local newspaper in a large city wants to assess support for the construction of a highway bypass around the central business district to reduce downtown traffic. They survey a random sample of 1152 residents and find that 543 of them support the bypass. Construct and interpret a 95% confidence interval to estimate the proportion of residents who support construction of the bypass.
What is the right answer and how?
Define lateral displacement.