Boxplots and bar graphs I'm studying for the GRE and came across several questions that I was unabl
Layla Velazquez
Answered question
2022-06-07
I'm studying for the GRE and came across several questions that I was unable to answer in a practice booklet, even after looking at the answer and trying to work backwards, and searching google and other sites for helpful hints. I think I am missing a fundamental understanding or useful heuristic for solving many of these problems; any advice would be greatly appreciated as my exam is Monday (Aug 1st).
1. Eight hundred insects were weighed, and the resulting measurements, in milligrams, are summarized in the boxplot below.
If the 80th percentile of the measurements is 130 milligrams, about how many measurements are between 126 milligrams and 130 milligrams?
I calculated the range (41), the quartiles(Q1=114, Q2=118, Q3=126), and the IQR (12), but I'm confused about the question. If the 80th percentile (so 80% of the measurements?) is at 130, then 640 are within this percentile. I'm not sure if this is true and even if it is, where to go from here. Each quartile is 25% of the data, correct? So from 126 to 146 must contain 25%, or 200 measurements? (1-.8)(200) = 40, but conceptually I'm lacking what that means.
2.This question refers to the following graph:
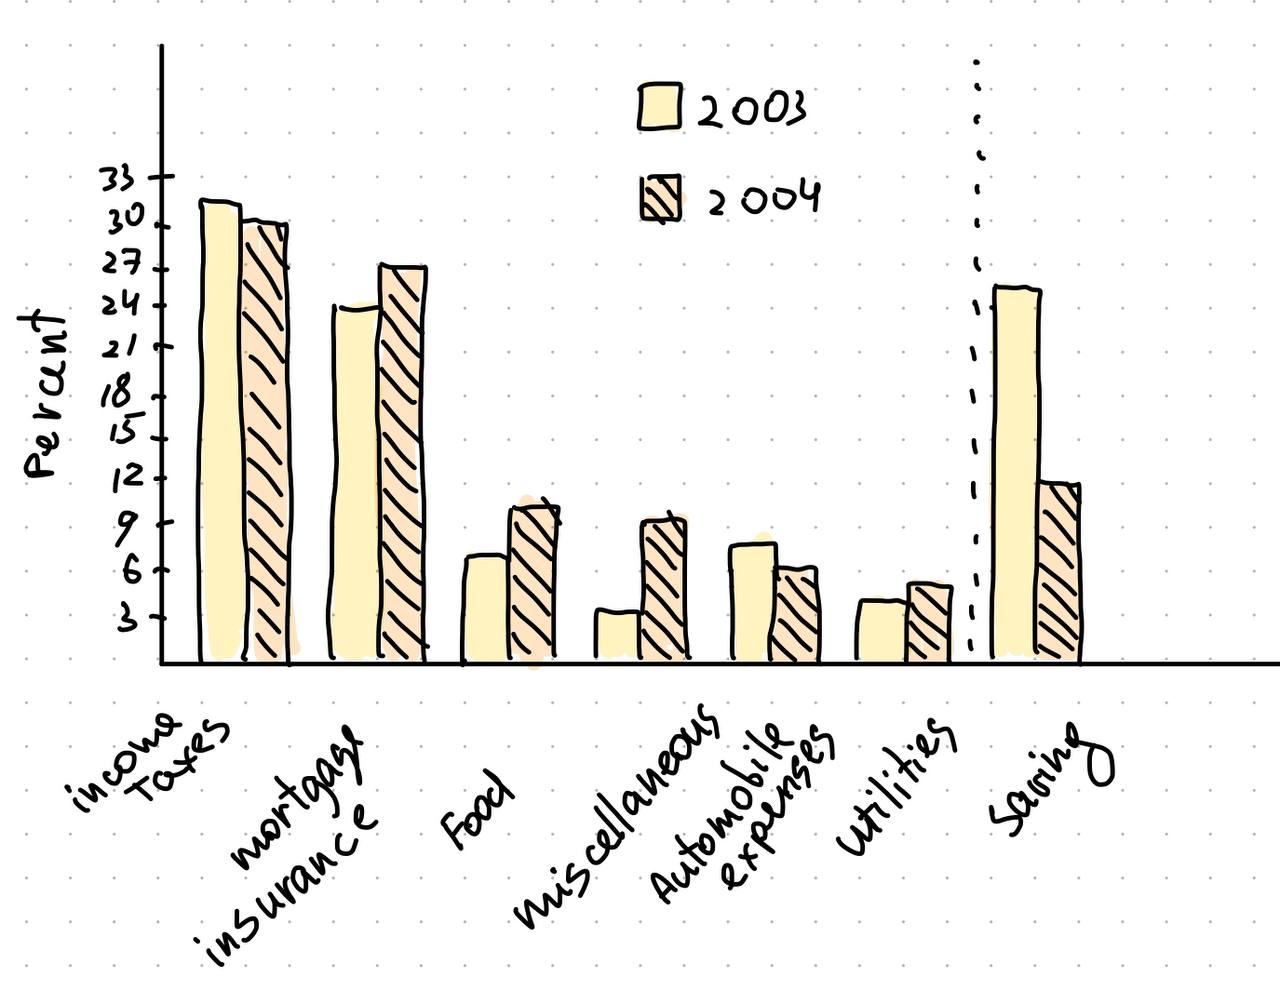
(a) In 2003 the family used a total of 49 percent of its gross annual income for two of the categories listed. What was the total amount of the family’s income used for those same categories in 2004 ?
My confusion lies with the fact that I can't seem to find any combination of two categories that add up to 49%. Plus, it seems that the total % expenditure in each year is 101%. The chart is not 100% accurately drawn, but even being very liberal in measuring there seems to be a discrepancy.
Answer & Explanation
Trey Ross
Beginner2022-06-08Added 30 answers
Alternatively, you could work from your observation that 640 of the measurements are at or below 130 mg. (That’s not 640 measurements within the 80th percentile, however: it’s 640 measurements within the first 80 percentiles altogether.) In exactly the same way you can calculate that 75%, or 600, of the 800 measurements are at or below 126 mg. Thus, 640−600=40 measurements must lie between 126 and 130 mg.
In the second question, Savings (25%) plus Mortgage, Insurance, & Property Taxes (24%) amounted to 49% in 2003; this doesn’t seem to require any generosity of interpretation of the graph. In 2004 those items come to 12+27=39% of $45,000, or $17,550.
New Questions in Descriptive Statistics
What is the range of the function ?
The domain and range of is
A)
B)
C)
D)Mean of the squares of the deviations from mean is called the:
Variance
Standard deviation
Quartile deviation
ModeHow to evaluate P(10,2)?
What is the effect of wind speed on evaporation?
What is the range of a linear function?
Find the range of
State the main limitations of statistics.
What is the range of the function y = x?
Tell whether the statement is true or false : A data always has a mode.

In most cases,_____variables are not considered to be equal unless they are exactly the same.
A local newspaper in a large city wants to assess support for the construction of a highway bypass around the central business district to reduce downtown traffic. They survey a random sample of 1152 residents and find that 543 of them support the bypass. Construct and interpret a 95% confidence interval to estimate the proportion of residents who support construction of the bypass.
What is the right answer and how?
Define lateral displacement.