Unlock the Secrets of Statistics and Probability with Expert Guidance and Real-World Application
Find the corresponding z-value whose area to the left is given.
a. 0.9049
b. 0.7794
c. 0.0029
a. 0.9049
b. 0.7794
c. 0.0029
True or false:
a. All normal distributions are symmetrical
b. All normal distributions have a mean of 1.0
c. All normal distributions have a standard deviation of 1.0
d. The total area under the curve of all normal distributions is equal to 1
a. All normal distributions are symmetrical
b. All normal distributions have a mean of 1.0
c. All normal distributions have a standard deviation of 1.0
d. The total area under the curve of all normal distributions is equal to 1
Which graphic display can be key in communicating complex study protocols?
A) CONSORT charts
B) Bubble map
C) Stem plots
D) Study outline
A) CONSORT charts
B) Bubble map
C) Stem plots
D) Study outline
The spinner is spun twice. Two possible outcomes art AC and CA.
a. Create a sample space that lists all of the equally likely outcomes.
b. Refer to the sample space to find the probability of spinning A one or more times in two spins.
a. Create a sample space that lists all of the equally likely outcomes.
b. Refer to the sample space to find the probability of spinning A one or more times in two spins.
What does it mean for a sample to have a standard deviation of zero? Describe the scores in such a sample?
State whether the investigation in question is an observational study or a designed experiment. Justify your answer in each case.
The Salk Vaccine. In the 1940s and early 1950s, the public was greatly concerned about polio. In an attempt to prevent this disease, Jonas Salk of the University of Pittsburgh developed a polio vaccine. In a test of the vaccine’s efficacy, involving nearly 2 million grade-school children, half of the children received the Salk vaccine, the other half received a placebo, in this case an injection of salt dissolved in water. Neither the children nor the doctors performing the diagnoses knew which children belonged to which group, but an evaluation center did. The center found that the incidence of polio was far less among the children inoculated with the Salk vaccine. From that information, the researchers concluded that the vaccine would be effective in preventing polio for all U.S. school children, consequently, it was made available for general use.
The Salk Vaccine. In the 1940s and early 1950s, the public was greatly concerned about polio. In an attempt to prevent this disease, Jonas Salk of the University of Pittsburgh developed a polio vaccine. In a test of the vaccine’s efficacy, involving nearly 2 million grade-school children, half of the children received the Salk vaccine, the other half received a placebo, in this case an injection of salt dissolved in water. Neither the children nor the doctors performing the diagnoses knew which children belonged to which group, but an evaluation center did. The center found that the incidence of polio was far less among the children inoculated with the Salk vaccine. From that information, the researchers concluded that the vaccine would be effective in preventing polio for all U.S. school children, consequently, it was made available for general use.
How many different ways can you make change for a quarter?
(Different arrangements of the same coins are not counted separately.)
(Different arrangements of the same coins are not counted separately.)
Straight Lines Graph the straight lines in Exercises 1–3.
Then find the change in y for a one-unit change in x, find the point at which the line crosses the y-axis, and calculate the value of y when x 52.5.
1.
2.
3.
Scatterplots For the scatterplots in Exercises 5 describe the pattern that you see. How strong is the pattern? Do you see any outliers or clusters?
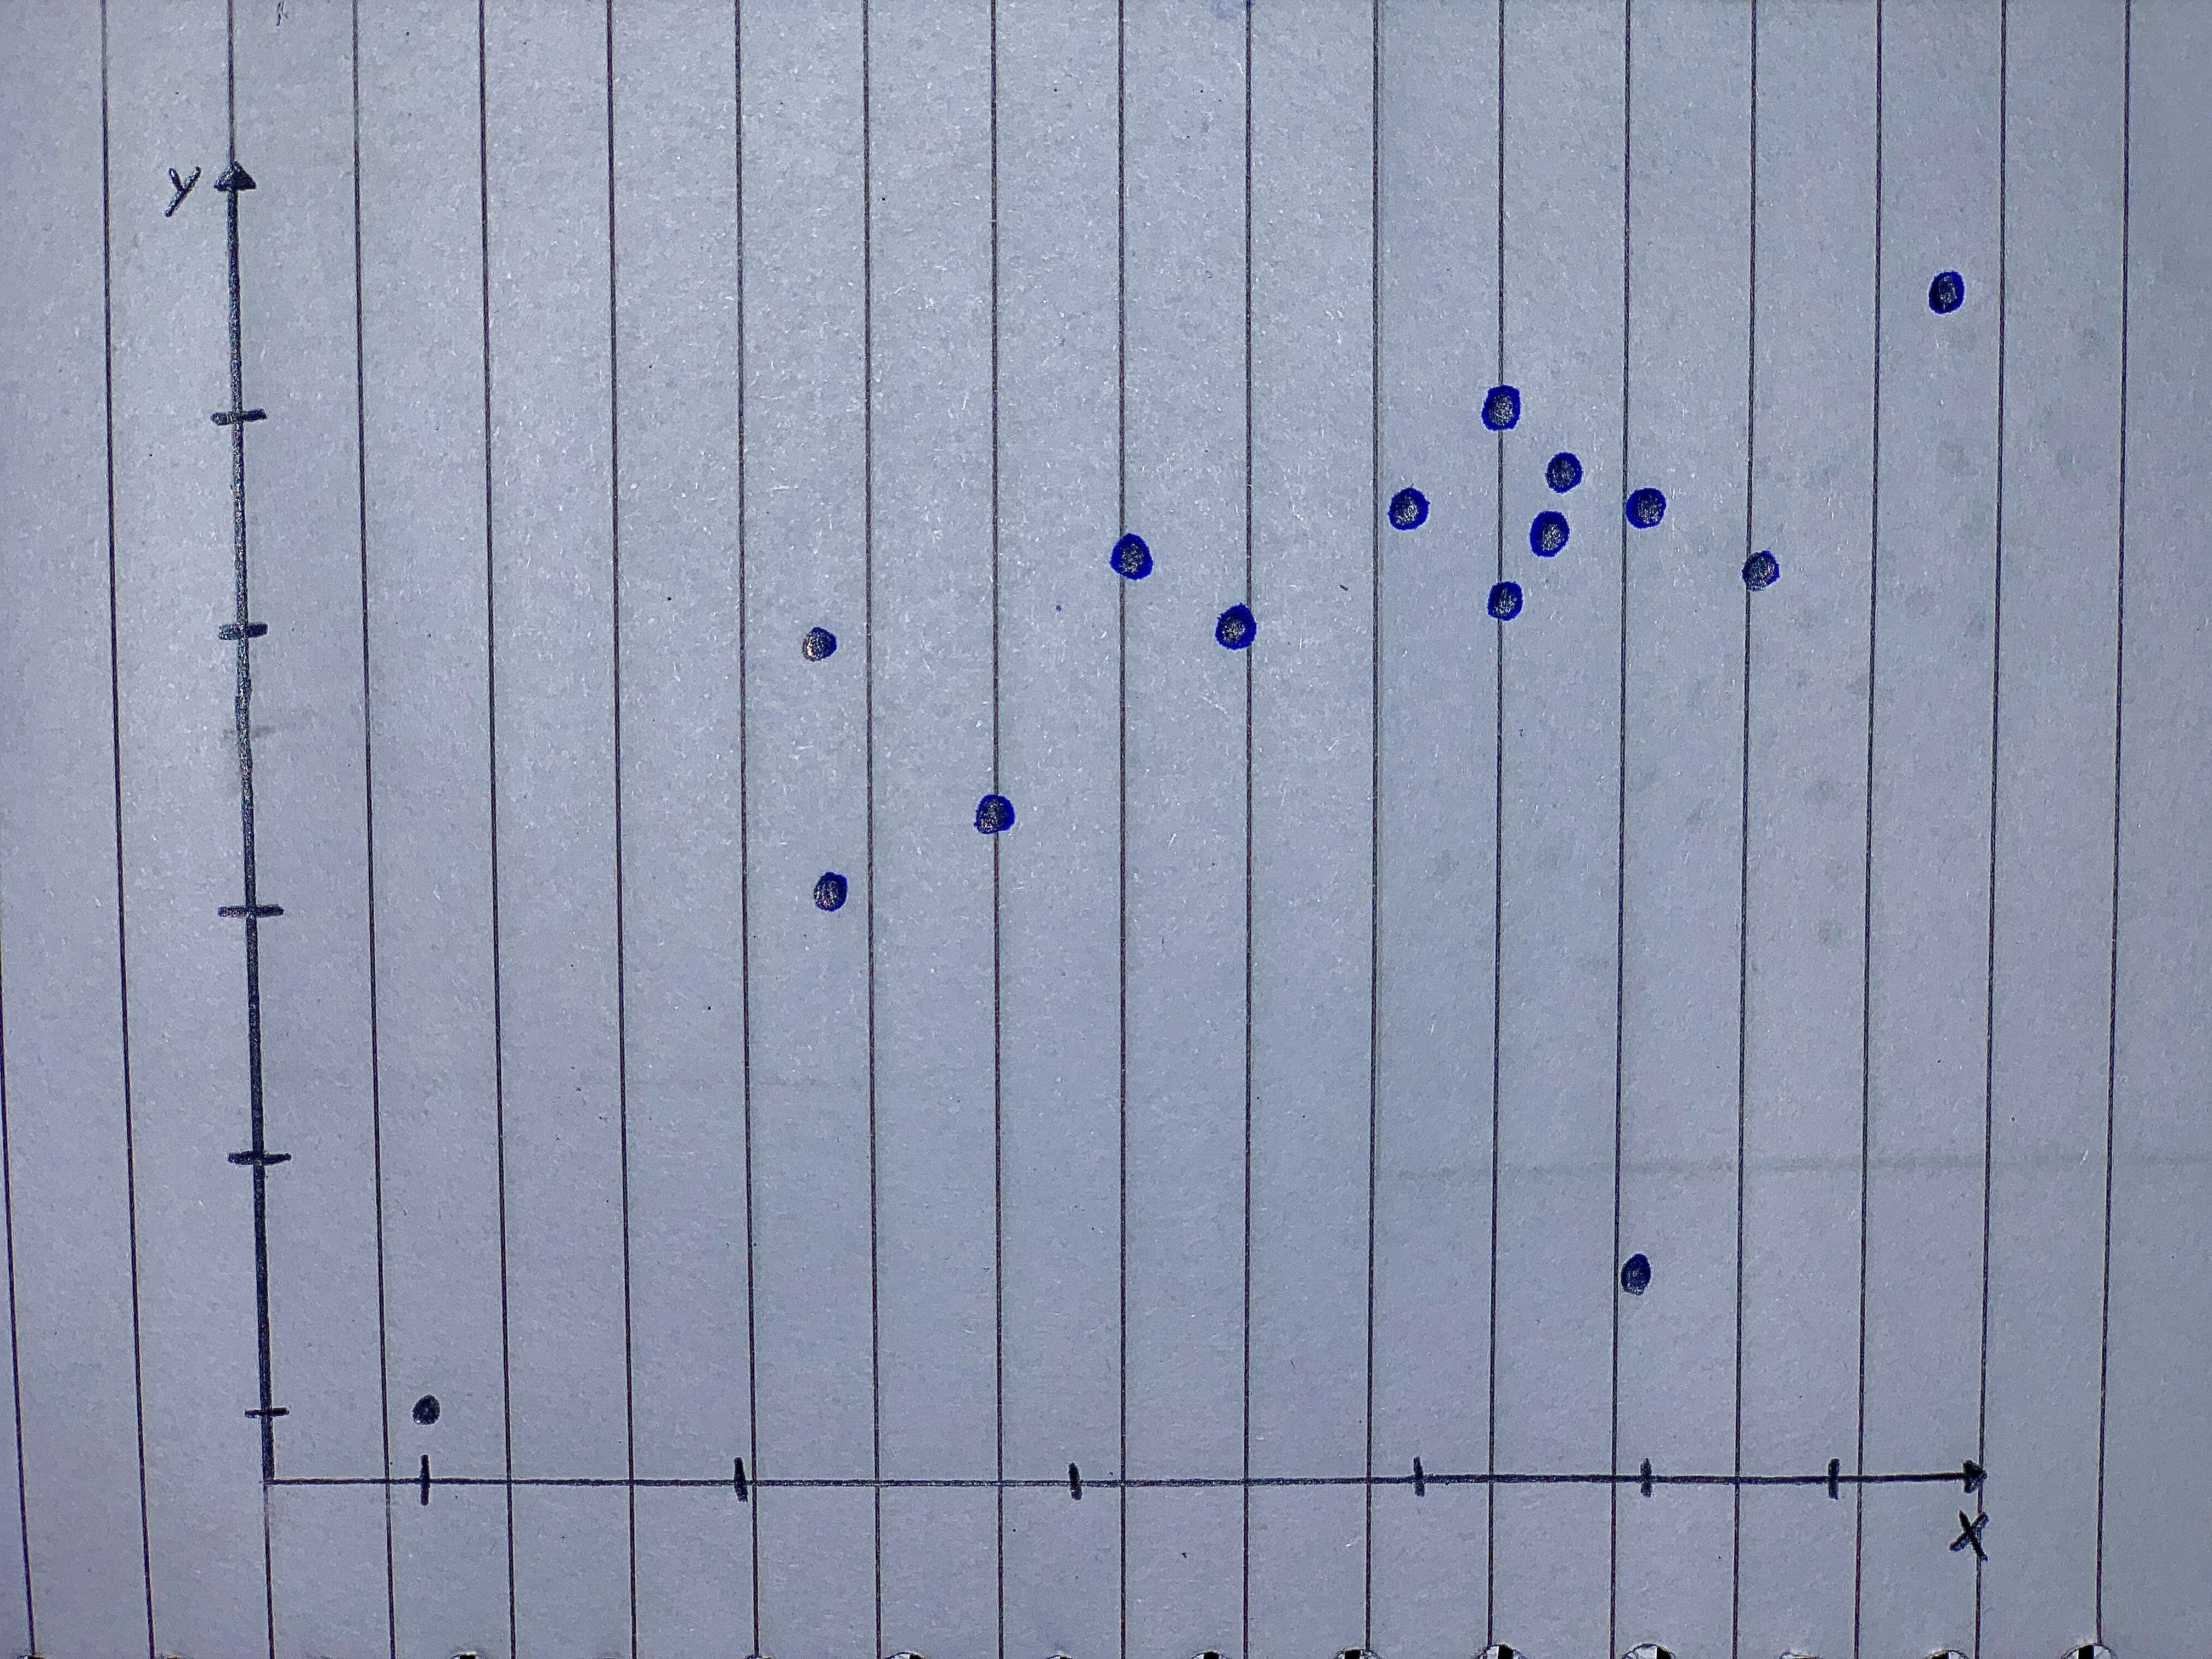
..........................
Straight Lines Graph the straight lines in Exercises 1–3.
Then find the change in y for a one-unit change in x, find the point at which the line crosses the y-axis, and calculate the value of y when x 52.5.
1.
2.
3.
Scatterplots For the scatterplots in Exercises 5 describe the pattern that you see. How strong is the pattern? Do you see any outliers or clusters?
..........................
When we want to test a claim about two population means, most of the time we do not know the population standard deviations, and we assume they are not equal. When this is the case, which of the following is/are not true?
-The samples are dependent
-The two populations have to have uniform distributions
-Both samples are simple random samples
-Either the two sample sizes are large or both samples come from populations having normal distributions or both of these conditions satisfied.
-The samples are dependent
-The two populations have to have uniform distributions
-Both samples are simple random samples
-Either the two sample sizes are large or both samples come from populations having normal distributions or both of these conditions satisfied.
Assume a Poisson distribution with lambda
Assume a Poisson distribution with lambda
Find the number of possible outcomes. A die is rolled 8 times.
Assume that when adults with smartphones are randomly selected, 46% use them in meetings or classes. If 20 adult smartphone users are randomly selected, find the probability that exactly 15 of them use their smartphones in meetings or classes.
X denotes a binomial random variable with parameters n and p. For each exercise, indicate which area under the appropriate normal curve would be determined to approximate the specified binomial probability.
X denotes a binomial random variable with parameters n and p. For each exercise, indicate which area under the appropriate normal curve would be determined to approximate the specified binomial probability.
A meteorologist preparing a talk about global warming compiled a list of weekly low temperatures (in degree s Fahrenheit) he observed at his southern Florida home last year. The coldest temperature for any week was 36°F, but he inadvertently recorded the Celsius value of 2°. Assuming that he correctly listed all the other temperatures, explain how this error will affect these summary statistics:
a) measures of center: mean and median.
b) measures of spread: range, IQR, and standard deviation.
a) measures of center: mean and median. b) measures of spread: range, IQR, and standard deviation.
We have a data set (n=100) with hormone concentrations and the frequency of each value. Assuming normal (continuous) distributions, We need to determine the parameters of the continuous probability distribution functions.
2,500 people were chosen at random for the sample, and when asked which season they preferred. Their responses, along with their age group, are summarized in the two-way table below.
Among those whose favorite season is spring, what proportion are adults?
2,500 people were chosen at random for the sample, and when asked which season they preferred. Their responses, along with their age group, are summarized in the two-way table below.
Among those whose favorite season is spring, what proportion are adults?
A bag contains 6 red, 4 blue and 8 green marbles. How many marbles of each color should be added so that the total number of marbles is 27, but the probability of randomly selecting one marble of each color remains unchanged.
The following two-way contingency table gives the breakdown of a town's population according to party affiliation (A, B, C, or None) and opinion on a property tax issue:
Opinion
A person is selected at random. What is the probability that the person is affiliated with parties A or B?
Opinion
A person is selected at random. What is the probability that the person is affiliated with parties A or B?
Find the expected count and the contribution to the chi-square statistic for the (Control, Disagree) cell in the two-way table below.
Round your answer for the excepted count to one decimal place, and your answer for the contribution to the chi-square statistic to three decimal places.
Expected count ?
Contribution to the chi-square statistic ?
Round your answer for the excepted count to one decimal place, and your answer for the contribution to the chi-square statistic to three decimal places.
Expected count ?
Contribution to the chi-square statistic ?
For the standard normal distribution, find the following probabilities.
(с)
(с)