Statistics Projects for High School Students
Recent questions in High school statistics
High school statisticsAnswered question
A pair of dice is rolled three times. What are the odds of five-total rolling each time?
High school statisticsAnswered question
Tell whether the sentence is TRUE or FALSE. “A two-way table used for a test of independence is sometimes called a contingency table.”
High school statisticsAnswered question
Create a problem for additional rules and do the two-way tables, please.
High school statisticsAnswered question
Suppose that you are testing the hypotheses
A sample of size 16 results in a sample mean of 11.5 and a sample standard deviation of 1.6.
What is the standard error of the mean?
Suppose that you are testing the hypotheses
A sample of size 16 results in a sample mean of 11.5 and a sample standard deviation of 1.6.
What is the standard error of the mean?
High school statisticsAnswered question
According to a market research firm, 52% of all residential telephone numbers in Los Angeles are unlisted.
A telephone sales firm uses random digit dialing equipment that dials residential numbers at random, whether or not they are listed in the telephone directory.
The firm calls 500 numbers in Los Angeles.
What is the probability that at least half the numbers dialed are unlisted? (Remember to check that you can use the Normal approximation.)
High school statisticsAnswered question
Assume that females have pulse rates that are normally distributed with a mean of 74. 0 beats per minute and a standard
deviation of 12.5 beats per minute.
If 1 adult female is randomly selected, find the probability that her pulse rate is greater
than 70 beats per minute.
If 1 adult female is randomly selected, find the probability that her pulse rate is greater than 70 beats per minute.
High school statisticsAnswered question
. a. 0.97
b. -0.97
c. 0.64
d. -0.64
. a. 0.97
b. -0.97
c. 0.64
d. -0.64
High school statisticsAnswered question
a) There are classes of 234 students, find the mean and standart deviation for the number born on the 4th of July. Ignore leap years.The value of the mean is
Yhe value of the standart deviation is
b) In a class of 234 students, would two be an unusually high number who were born on the 4th of July? Would 2 be an unussually high number of individuals who were born on the 4th of July?
A. This result is unlikely because 2 is within the range of usual values.
B. No, because 2 is within the range of usual values.
C. Yes, because 2 is greater than the maximum usual value.
D. Yes, because 2 is below the minimum usual value.
High school statisticsAnswered question
Graph the following data on a scatterplot. a. Does the graph show either a positive or a negative association? b. Does there appear to be a connection between height and spelling ability? c. Does greater height cause better spelling ability? d. What other factors could create the association you see?
Graph the following data on a scatterplot. a. Does the graph show either a positive or a negative association? b. Does there appear to be a connection between height and spelling ability? c. Does greater height cause better spelling ability? d. What other factors could create the association you see?
High school statisticsAnswered question
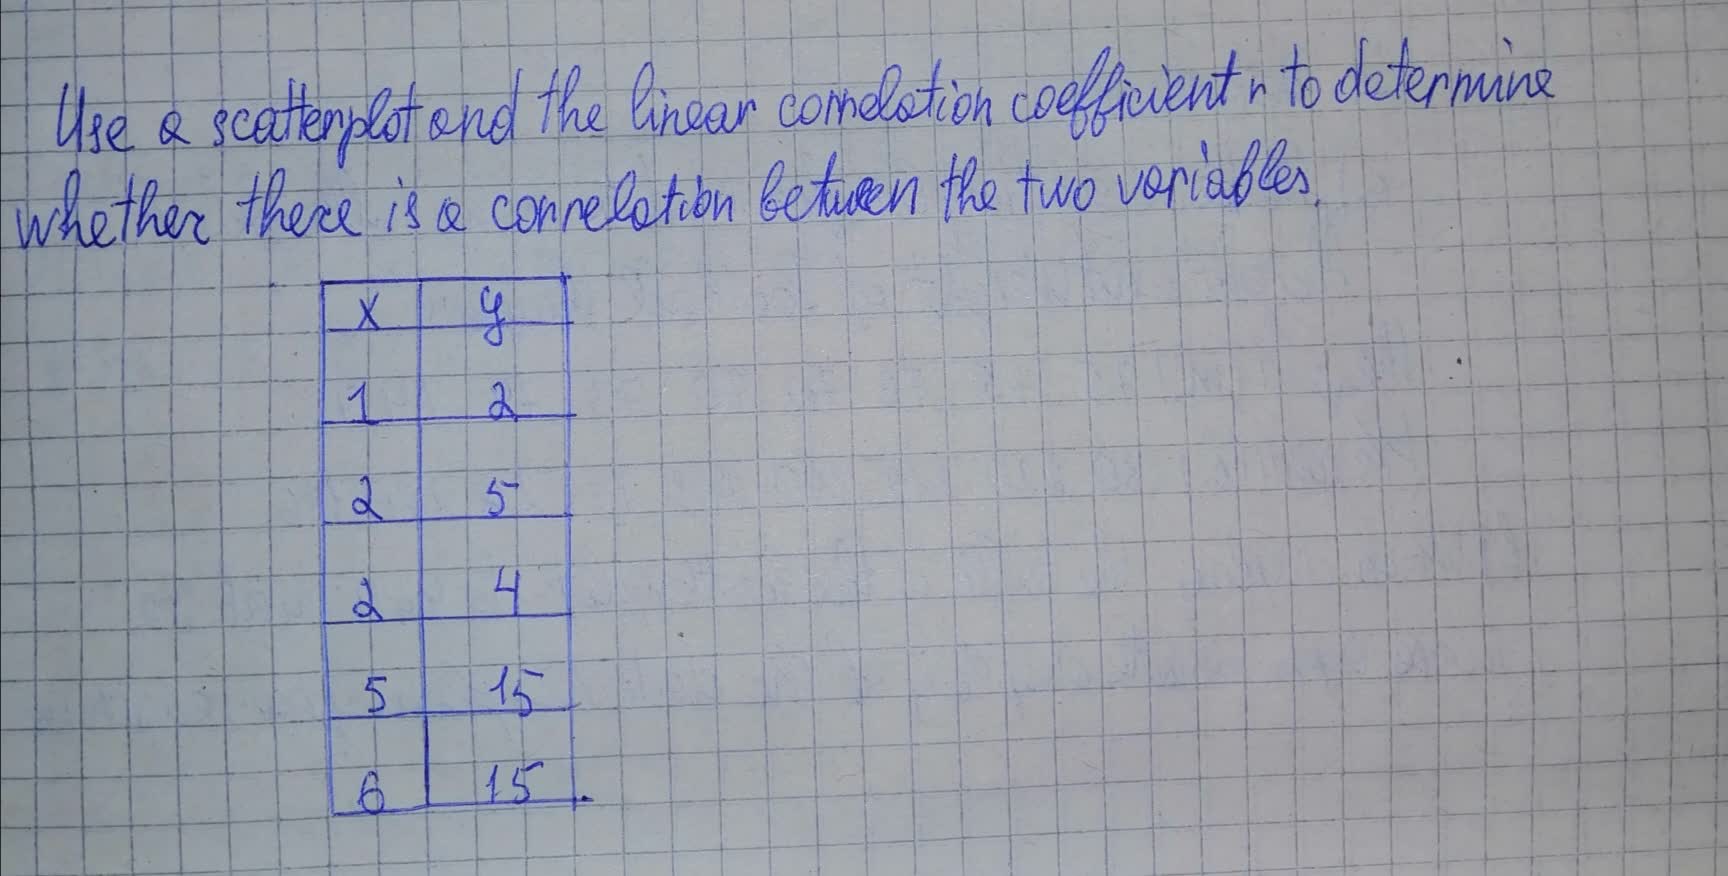
Use a scatterplot and the linear correlation coefficient r to determine whether there is a correlation between the two variables
High school statisticsAnswered question
A survey was designed to study how business operations vary according to their size. Companies were classified as small, medium, or large.

High school statisticsAnswered question
Sketch a scatterplot where the association is linear, but the correlation is close to r = 0.

High school statisticsAnswered question
Make a scatterplot of the data and graph the function

High school statisticsAnswered question
Sketch a scatterplot where the association is nonlinear, but the correlation is close to r = -1.

High school statisticsAnswered question
Suppose that each student in a sample had been categorized with respect to political views, marijuana usage, and religious preference, with the categories of this latter factor being Protestant, Catholic, and other. The data could be displayed in three different two-way tables, one corresponding to each category of the third factor.

High school statisticsAnswered question
Construct a scatterplot and identify the
mathematical model that best fits the given data.

High school statisticsAnswered question
This exercise concern time series. a. obtain a scatterplot for the data. b. find and interpret the regression equation. c. make the specified forecasts. Is there evidence of global warming in the records of ice cover on lakes?

High school statisticsAnswered question
Make a scatterplot for the data in the table below.
Height (in.): 77 75 76 70 70 73 74 74 73
Weight (lb): 230 220 212 190 201 245 218 260 196

Height (in.): 77 75 76 70 70 73 74 74 73
Weight (lb): 230 220 212 190 201 245 218 260 196
High school statisticsAnswered question
Study the scatterplots and rank correlations displayed in your classroom

As a rule, high school statistics help is quite hard to find because once a student starts looking for statistics help, it comes up with more advanced help in this regard. Taking this problem into consideration, we have collected some helpful high school statistics questions and answers that will meet the high-school level standards. Looking into these will help you to find the most suitable solution or post your own questions based on equations, data reports, and so on. Take your time to explore available high school statistics questions as these will be mostly similar to what you may have.