Stepwise Descriptive Statistics Learning
Recent questions in Descriptive Statistics
Descriptive StatisticsAnswered question
For where is the number of successes and the is the probability of success. Also we have:
Shown that . So:
And after a long calculation, I've found that the mode is the integer part of . Where I did wrong?
Shown that . So:
And after a long calculation, I've found that the mode is the integer part of . Where I did wrong?
Descriptive StatisticsAnswered question
What is a numerical variable and what is a categorical variable?
Descriptive StatisticsAnswered question
The mode of a binomial distribution is equal to . I am wondering how to estimate the probability at this value, i.e. , like what's the order of this value in terms of . Is it exp()?
Descriptive StatisticsAnswered question
A distribution has a standard deviation of o=10. Find the z-score for each of the following locations in the distribution.
a) Above the mean by 5 points b) Above the mean by 2 points c) Below the mean by 20 points d) Below the mean by 15 points
Please don't give me the answer, but explain how I would work this out.
a) Above the mean by 5 points b) Above the mean by 2 points c) Below the mean by 20 points d) Below the mean by 15 points
Please don't give me the answer, but explain how I would work this out.
Descriptive StatisticsAnswered question
Find the mode, we need to find the value of for which and . After applying derivative to the pdf, how do we proceed?
Descriptive StatisticsAnswered question
Prove that if diam(G)=3 for a regular graph G, then .
I know that without using regularity one can show that if . How do I use regularity to show that it must be exactly 2?
I know that without using regularity one can show that if . How do I use regularity to show that it must be exactly 2?
Descriptive StatisticsAnswered question
Boxplots and bar graphs
I'm studying for the GRE and came across several questions that I was unable to answer in a practice booklet, even after looking at the answer and trying to work backwards, and searching google and other sites for helpful hints. I think I am missing a fundamental understanding or useful heuristic for solving many of these problems; any advice would be greatly appreciated as my exam is Monday (Aug 1st).
1. Eight hundred insects were weighed, and the resulting measurements, in milligrams, are summarized in the boxplot below.
If the 80th percentile of the measurements is 130 milligrams, about how many measurements are between 126 milligrams and 130 milligrams?
I calculated the range (41), the quartiles(Q1=114, Q2=118, Q3=126), and the IQR (12), but I'm confused about the question. If the 80th percentile (so 80% of the measurements?) is at 130, then 640 are within this percentile. I'm not sure if this is true and even if it is, where to go from here. Each quartile is 25% of the data, correct? So from 126 to 146 must contain 25%, or 200 measurements? (1-.8)(200) = 40, but conceptually I'm lacking what that means.
2.This question refers to the following graph:
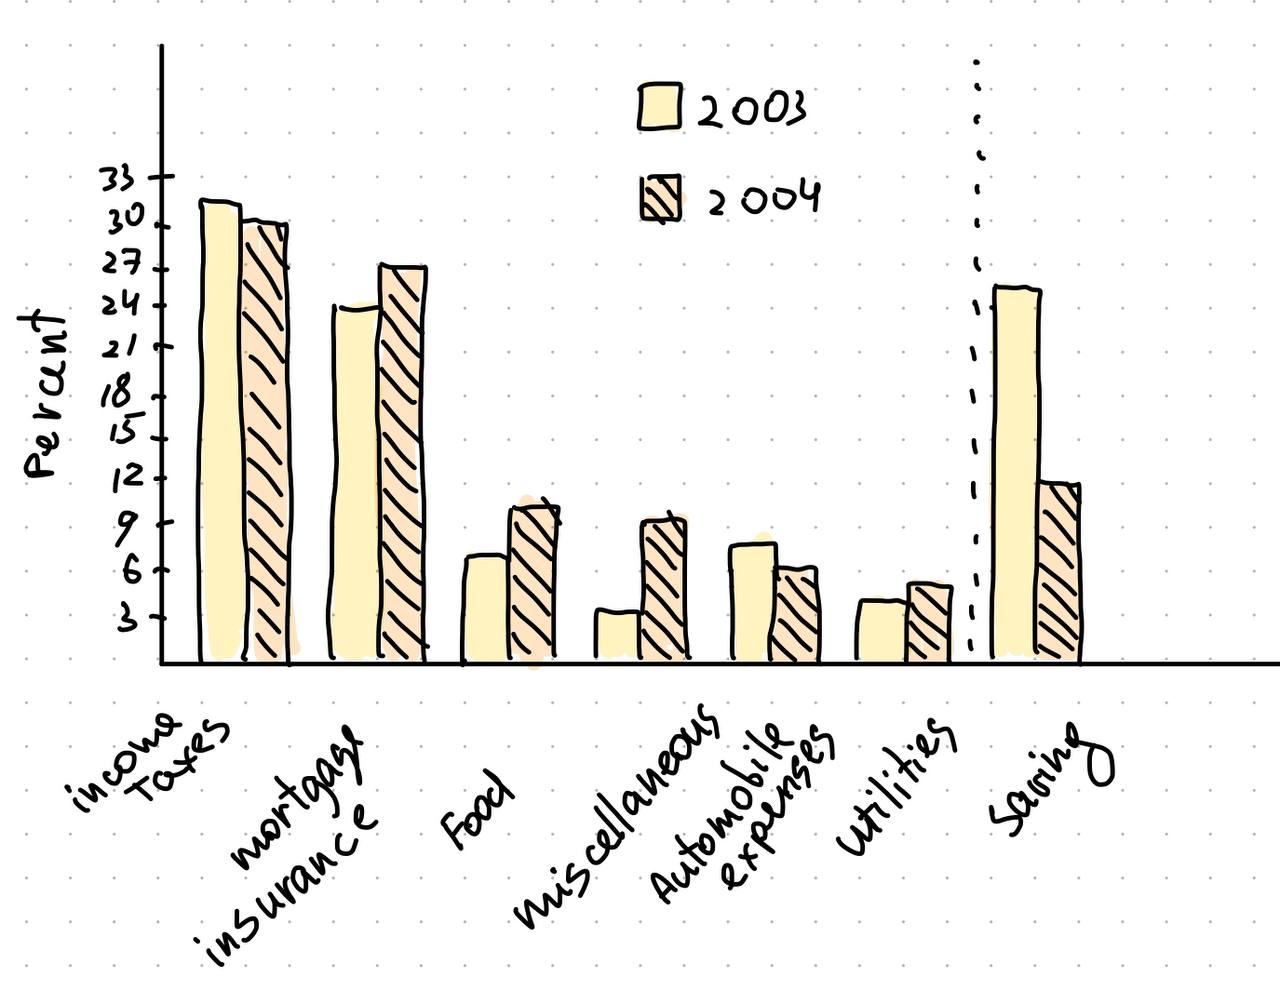
(a) In 2003 the family used a total of 49 percent of its gross annual income for two of the categories listed. What was the total amount of the family’s income used for those same categories in 2004 ?
My confusion lies with the fact that I can't seem to find any combination of two categories that add up to 49%. Plus, it seems that the total % expenditure in each year is 101%. The chart is not 100% accurately drawn, but even being very liberal in measuring there seems to be a discrepancy.
I'm studying for the GRE and came across several questions that I was unable to answer in a practice booklet, even after looking at the answer and trying to work backwards, and searching google and other sites for helpful hints. I think I am missing a fundamental understanding or useful heuristic for solving many of these problems; any advice would be greatly appreciated as my exam is Monday (Aug 1st).
1. Eight hundred insects were weighed, and the resulting measurements, in milligrams, are summarized in the boxplot below.
If the 80th percentile of the measurements is 130 milligrams, about how many measurements are between 126 milligrams and 130 milligrams?
I calculated the range (41), the quartiles(Q1=114, Q2=118, Q3=126), and the IQR (12), but I'm confused about the question. If the 80th percentile (so 80% of the measurements?) is at 130, then 640 are within this percentile. I'm not sure if this is true and even if it is, where to go from here. Each quartile is 25% of the data, correct? So from 126 to 146 must contain 25%, or 200 measurements? (1-.8)(200) = 40, but conceptually I'm lacking what that means.
2.This question refers to the following graph:
(a) In 2003 the family used a total of 49 percent of its gross annual income for two of the categories listed. What was the total amount of the family’s income used for those same categories in 2004 ?
My confusion lies with the fact that I can't seem to find any combination of two categories that add up to 49%. Plus, it seems that the total % expenditure in each year is 101%. The chart is not 100% accurately drawn, but even being very liberal in measuring there seems to be a discrepancy.
Descriptive StatisticsAnswered question
A list of 11 positive integers has a mean of 10, a median of 9, and a unique mode of 8. What is the largest possible value of an integer in the list?
From the information, I got the following information:
11 integers with a mean of 10 means a total must be 110.
A unique mode means that there must be at least two 8's.
if there are two 8's, and the median is 9, there must be at least two numbers greater than 9 also.
From the information, I got the following information:
11 integers with a mean of 10 means a total must be 110.
A unique mode means that there must be at least two 8's.
if there are two 8's, and the median is 9, there must be at least two numbers greater than 9 also.
Descriptive StatisticsAnswered question
MathJax(?): Can't find handler for document
MathJax(?): Can't find handler for document
Calculator mode. ENG mode?? (SCI vs. FLO vs. ENG)
When I type 8 ∗ 6
FLO =
SCI =
ENG =
1) What is the point of ENG mode??
2) What are situations where you want answers in SCIentific notation?
When I type
FLO =
SCI =
ENG =
1) What is the point of ENG mode??
2) What are situations where you want answers in SCIentific notation?
Descriptive StatisticsOpen question
Ten randomly selected people were asked how long they slept at night. The mean time
was 7.1 hours, and the standard deviation was 0.78 hour. Find the 95% confidence
interval of the mean time. Assume the variable is normally distributed.
Ten randomly selected people were asked how long they slept at night. The mean time
was 7.1 hours, and the standard deviation was 0.78 hour. Find the 95% confidence
interval of the mean time. Assume the variable is normally distributed.
Descriptive StatisticsAnswered question
I saw this somewhere. Is this right?
Most z-score table stops at 3.4. If this is right, kindly explain how it was gotten. Thanks
Most z-score table stops at 3.4. If this is right, kindly explain how it was gotten. Thanks
Descriptive StatisticsAnswered question
for the frequency distribution given below
find mean ,median mode what percent of the population is non negative what percent of the population is negative valued
find mean ,median mode what percent of the population is non negative what percent of the population is negative valued
Descriptive StatisticsAnswered question
Consider a "discrete" random variable . A mode of is just a maximizer of . This is obviously useful, and we can easily see that a mode is a "most likely" value for .
If, instead, we have a "continuous" real-valued random variable with a PDF , I think we usually define a mode of to be a maximizer of . I have two questions:
1. How can we interpret the mode of a continuous random variable? In other words, why is the mode of a continuous random variable useful to probability theory?
2. Is there a more general definition of mode, removing the assumptions above that is real-valued and has a PDF?
Descriptive StatisticsAnswered question
Given a sample (the scope is 72 elements) with mode=54 mean=55,7 median=54,5. The 73th value of the extended sample is 56. What can I say about the mode, median and mean of the extended sample?
Descriptive StatisticsAnswered question
From a given z-score, what is the formula for calculating the probability of the deviation being due to chance?
e.g.
Given z = 1.2 standard deviations
The chance probability p = 0.11507
How did we derive p? (i.e. the formula, without having to refer to the normal distribution table)
e.g.
Given z = 1.2 standard deviations
The chance probability p = 0.11507
How did we derive p? (i.e. the formula, without having to refer to the normal distribution table)
Descriptive StatisticsAnswered question
Let X denote the lifetime (in hours) of a light bulb, and assume that the density function of X is given by

On average, what fraction of light bulbs last more than 15 minutes?
Let X denote the lifetime (in hours) of a light bulb, and assume that the density function of X is given by
On average, what fraction of light bulbs last more than 15 minutes?
Descriptive StatisticsOpen question
calculating the correct sample size is a critical component of a study design. t/f. quizlet
calculating the correct sample size is a critical component of a study design. t/f. quizlet
Descriptive StatisticsAnswered question
Find the 95% confidence interval for estimating the population mean μ If sample mean X = 50, sample size n= 60 and population standard deviation σ is known to be 10.
Find the 95% confidence interval for estimating the population mean μ If sample mean X = 50, sample size n= 60 and population standard deviation σ is known to be 10.
Descriptive StatisticsAnswered question
Find P( X > 18.7 | X > 11.7 ).
Attempt: Rewrite as P ( x > 18.7) - P( x > 11.7)
Using the phi function
Where did I go wrong?
Find P( X > 18.7 | X > 11.7 ).
Attempt: Rewrite as P ( x > 18.7) - P( x > 11.7)
Using the phi function
Where did I go wrong?
Descriptive StatisticsAnswered question
Mentioned that the mode of negative binomial distribution can be found by: t = 1 + ((r-1)/p) where t is some number, r is the number of successes and p is the probability of success If t is an integer, there will be 2 modes at t and t-1 If t is not an integer, the integer part of t is the mode.
This is what I have worked on so far: ((r-1)/p) is the expected number of attempts to achieve all required successes excluding the final success The expected number of attempts + the definite final success = the total number of expected attempts.The total number of expected attempts is the mode.
Why could there be two modes of t-1 and t?
[I am stuck here]
When you are majoring in subjects like Engineering, Sociology, or Economics, the chances are high that you will require descriptive statistics help, which basically stands for those cases when you need to provide more than calculations or statistical data that is presented in numbers. You may also require general help with the equations, which is why the list of answers presented will help you to proceed with your challenges. You can start with the bar graphs example We also list several descriptive statistics examples that will make it easier to understand how this part of statistics and probability works. In case you need to provide