Bar Graphs: Practical Examples & Insights
Recent questions in Bar Graphs
Descriptive StatisticsAnswered question
Linear functions versus Logarithmic and Exponential functions
If a function is linear, I know that this should be true:
Where is the point exactly in between and . Now, I know from looking at their graphs that the same shouldn't be true for logarithmic and exponential functions. That is, for logarithmic functions:
And for exponential functions:
I'm not a mathematician by formation, but I feel like it should be possible to prove this without having to look at their graph. Does anyone know how to do this?
Descriptive StatisticsAnswered question
How to demonstrate that , G is a bipartite graph
If G is a bipartite graph then ?
If G is a bipartite graph then ?
Descriptive StatisticsAnswered question
chromatic number of a graph versus its complement
What can be said about the rate of growth of f(n), defined by
where the minimum is taken over all graphs G on n vertices.
Two observations.
(1) Either G or contains a clique on roughly logn vertices by Ramsey theory, so for some constant .
(2) If G=G(n,1/2) is a random graph, then n/ log n almost surely, so we also have n/log n for some constant .
These bounds seem hopelessly far apart.
Can we improve on the bounds
for all sufficiently large n?
Descriptive StatisticsAnswered question
Prove that a self-complementary graph has radius 2 and diameter 2 or 3.
I think that is one of the well-known properties of self-complementary graphs, but I am having some troubles trying to prove it. The facts that, if , then both graphs G and are connected, and that, for any graph, if then , and that if then , should make the proof quite easier, but I don't know how to develop it. Could you help me? Thanks in advance!
I think that is one of the well-known properties of self-complementary graphs, but I am having some troubles trying to prove it. The facts that, if , then both graphs G and are connected, and that, for any graph, if then , and that if then , should make the proof quite easier, but I don't know how to develop it. Could you help me? Thanks in advance!
Descriptive StatisticsAnswered question
complete k-partite graphs
I am trying to solve the following problem:
Let G be a nonempty graph with the property that whenever and , then . Prove that G has this property if and only if G is a complete k-partite graph for some . (Consider ).
The converse is straightforward and is given by the definition of the complete k-partite graphs, however, the direct way is not trivial and I could not get it.
Descriptive StatisticsAnswered question
Prove for chromatic number of graph and its complement
Let us denote by χ(G) the chromatic number, which is the smallest number of colours needed to colour the graph G with n vertices. Let be the complement of G. Show that
I was able to prove (a) using induction. Any hints on proving (b)?
Let us denote by χ(G) the chromatic number, which is the smallest number of colours needed to colour the graph G with n vertices. Let be the complement of G. Show that
I was able to prove (a) using induction. Any hints on proving (b)?
Descriptive StatisticsAnswered question
Graph median, mode, range

The question is:
A scientist collects data. He determines both the mean of the data and the median of the data are equal to 7 and the data are symmetrical about this value. He starts to create a bar graph shown, but does not finish the graph.
If the range of the data is 8 and the maximum value of the data is 11, then how many data points fall above the value 7?
The answer is 14, but I don't know how this is the answer.
Descriptive StatisticsAnswered question
Using a truth table, check the validity of the following argument: “If Jane won the competition, then either Mary came second or Silva came third. Silva didn’t come third. Thus, if Mary didn’t come second, then Jane didn’t win the competition.”
Using a truth table, check the validity of the following argument: “If Jane won the competition, then either Mary came second or Silva came third. Silva didn’t come third. Thus, if Mary didn’t come second, then Jane didn’t win the competition.”
Descriptive StatisticsAnswered question
Prove that if diam(G)=3 for a regular graph G, then .
I know that without using regularity one can show that if . How do I use regularity to show that it must be exactly 2?
I know that without using regularity one can show that if . How do I use regularity to show that it must be exactly 2?
Descriptive StatisticsAnswered question
Boxplots and bar graphs
I'm studying for the GRE and came across several questions that I was unable to answer in a practice booklet, even after looking at the answer and trying to work backwards, and searching google and other sites for helpful hints. I think I am missing a fundamental understanding or useful heuristic for solving many of these problems; any advice would be greatly appreciated as my exam is Monday (Aug 1st).
1. Eight hundred insects were weighed, and the resulting measurements, in milligrams, are summarized in the boxplot below.
If the 80th percentile of the measurements is 130 milligrams, about how many measurements are between 126 milligrams and 130 milligrams?
I calculated the range (41), the quartiles(Q1=114, Q2=118, Q3=126), and the IQR (12), but I'm confused about the question. If the 80th percentile (so 80% of the measurements?) is at 130, then 640 are within this percentile. I'm not sure if this is true and even if it is, where to go from here. Each quartile is 25% of the data, correct? So from 126 to 146 must contain 25%, or 200 measurements? (1-.8)(200) = 40, but conceptually I'm lacking what that means.
2.This question refers to the following graph:
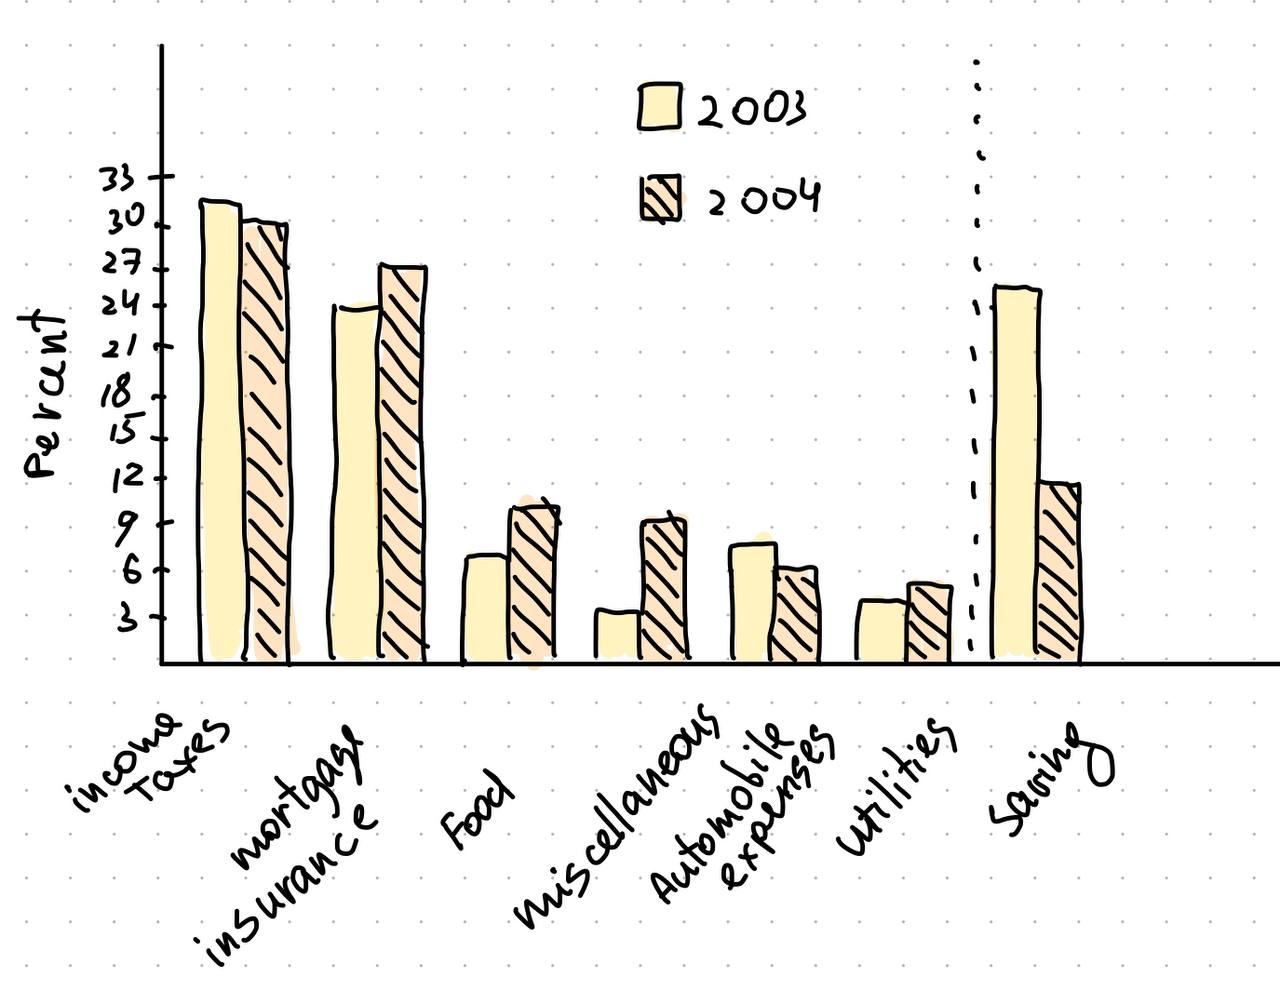
(a) In 2003 the family used a total of 49 percent of its gross annual income for two of the categories listed. What was the total amount of the family’s income used for those same categories in 2004 ?
My confusion lies with the fact that I can't seem to find any combination of two categories that add up to 49%. Plus, it seems that the total % expenditure in each year is 101%. The chart is not 100% accurately drawn, but even being very liberal in measuring there seems to be a discrepancy.
I'm studying for the GRE and came across several questions that I was unable to answer in a practice booklet, even after looking at the answer and trying to work backwards, and searching google and other sites for helpful hints. I think I am missing a fundamental understanding or useful heuristic for solving many of these problems; any advice would be greatly appreciated as my exam is Monday (Aug 1st).
1. Eight hundred insects were weighed, and the resulting measurements, in milligrams, are summarized in the boxplot below.
If the 80th percentile of the measurements is 130 milligrams, about how many measurements are between 126 milligrams and 130 milligrams?
I calculated the range (41), the quartiles(Q1=114, Q2=118, Q3=126), and the IQR (12), but I'm confused about the question. If the 80th percentile (so 80% of the measurements?) is at 130, then 640 are within this percentile. I'm not sure if this is true and even if it is, where to go from here. Each quartile is 25% of the data, correct? So from 126 to 146 must contain 25%, or 200 measurements? (1-.8)(200) = 40, but conceptually I'm lacking what that means.
2.This question refers to the following graph:
(a) In 2003 the family used a total of 49 percent of its gross annual income for two of the categories listed. What was the total amount of the family’s income used for those same categories in 2004 ?
My confusion lies with the fact that I can't seem to find any combination of two categories that add up to 49%. Plus, it seems that the total % expenditure in each year is 101%. The chart is not 100% accurately drawn, but even being very liberal in measuring there seems to be a discrepancy.


- 1
- 2
Statistical bar graphs stand for the categorical variables, discrete variables, or continuous ones that should be grouped in class intervals. There will be other types of examples that you can find in our list of answers to the statistical questions. They will help you build the diagrams in statistics. If you are dealing with equations, you will use different types of bar graphs like multiple or stacked, depending on what kind of statistical data must be applied. Ensure that you check how the graphical sections have been answered. It will let you connect the variables and see how they function.