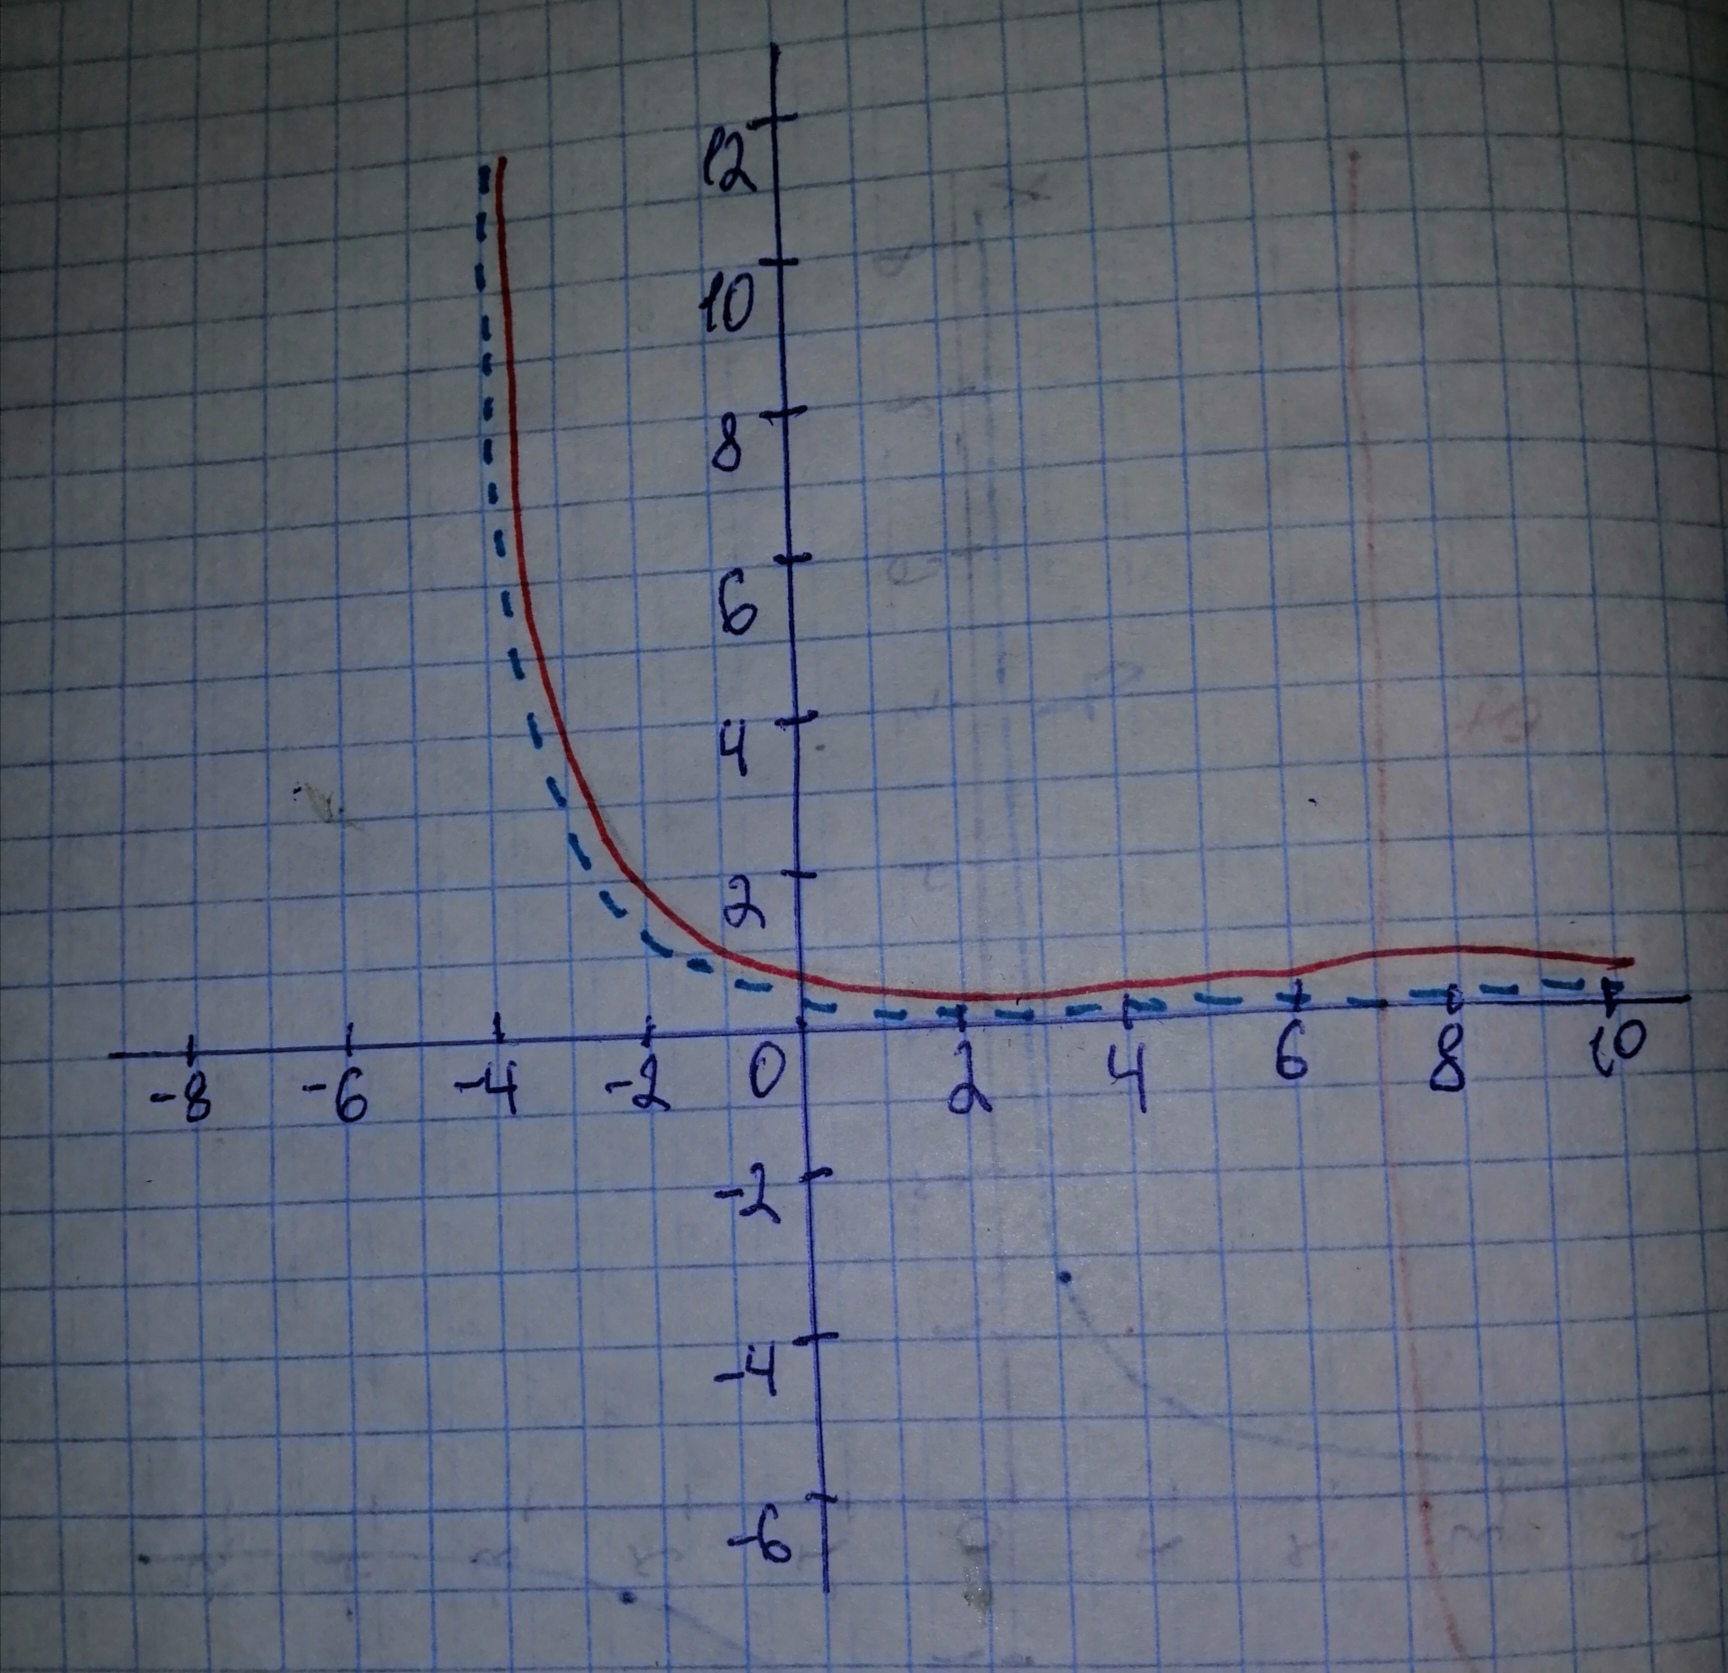
Use transformations to sketch the graph of the function. s(x)=1 + 0.5^{x}
jernplate8
Answered question
2020-11-06
Answer & Explanation
Nathaniel Kramer
Skilled2020-11-07Added 78 answers
Step 1
Remember that: When we reflect the graph of
We will start the graph of the standard function
Reflect the graph of
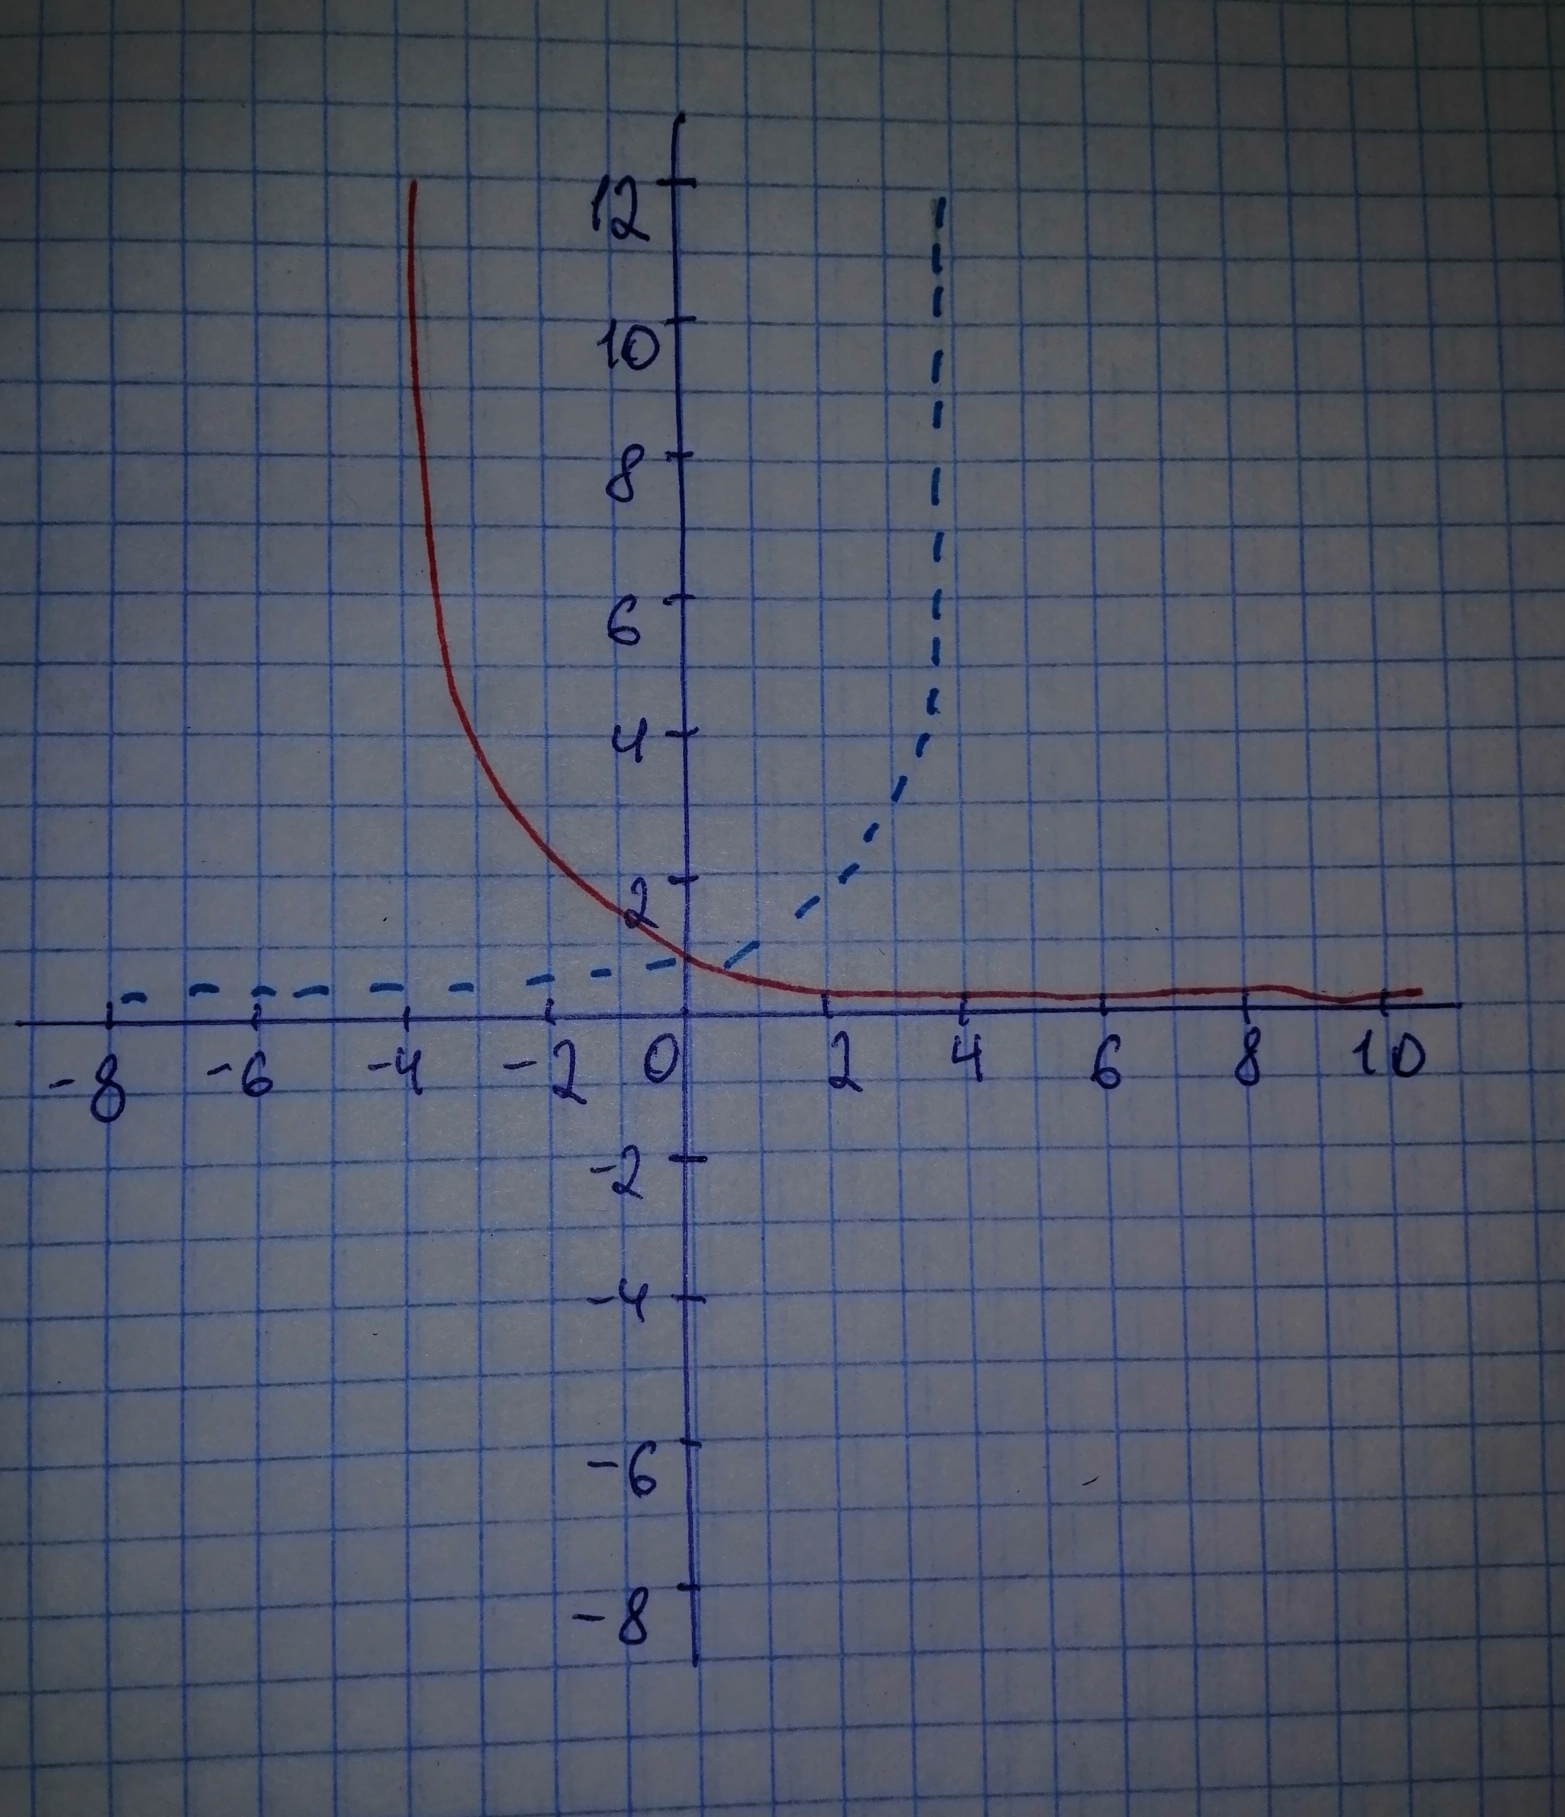
Step 2
Remember that: When we shift the graph of
Shift the graph of
The graph for
New Questions in Precalculus
Describe all solutions of Ax=0 in parametric vector form, where A is row equivalent to the given matrix
Find, correct to the nearest degree, the three angles of the triangle with the given vertices
A(1, 0, -1), B(3, -2, 0), C(1, 3, 3)Whether f is a function from Z to R if
?
a) .
b) .
c) .How to write the expression in radical form?
How to evaluate ?
What is the derivative of ?
How to verify the identity: ?
Find using the half-angle formula.
How to find the exact values of using the half-angle formula?
How to express the complex number in trigonometric form: 5-5i?
The solution set of is
How to find the angle between the vector and axis?
Find the probability of getting 5 Mondays in the month of february in a leap year.
How to find the inflection points for the given function ?
How do I find the value of sec(3pi/4)?