To draw a pie chart, you need to represent each part of the data as a proportion of 360, because there are 360 degrees in a circle.
Brendon Watson
Answered question
2023-03-16
a) How many people, in this group, have blood type AB?
b) How many people, in this group, do not have blood type O?
c) How many people, in this group, have blood types A or B?
Answer & Explanation
lonleylover89qo42
Beginner2023-03-17Added 4 answers
b) people
c) people
New Questions in High school geometry
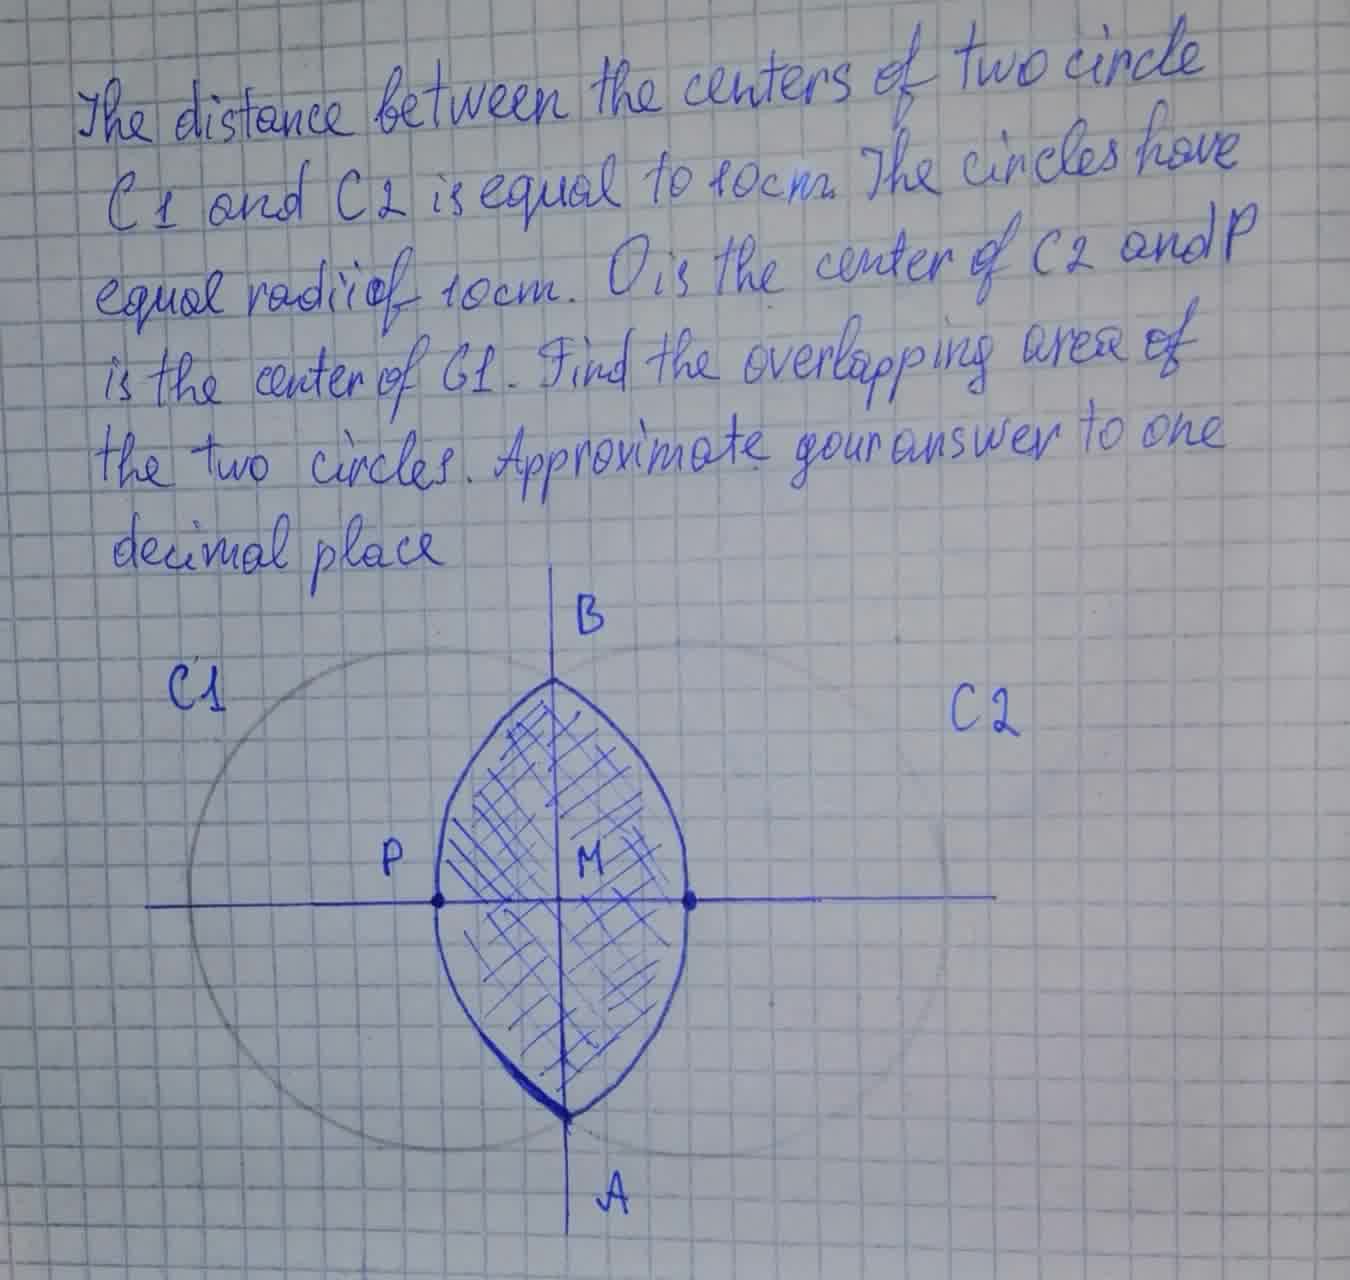
The distance between the centers of two circles C1 and C2 is equal to 10 cm. The circles have equal radii of 10 cm.
A part of circumference of a circle is called
A. Radius
B. Segment
C. Arc
D. SectorThe perimeter of a basketball court is 108 meters and the length is 6 meters longer than twice the width. What are the length and width?
What are the coordinates of the center and the length of the radius of the circle represented by the equation ?
Which of the following pairs of angles are supplementary?
128,62
113,47
154,36
108,72What is the surface area to volume ratio of a sphere?
An angle which measures 89 degrees is a/an _____.
right angle
acute angle
obtuse angle
straight angleHerman drew a 4 sided figure which had only one pair of parallel sides. What could this figure be?
Trapezium
Parallelogram
Square
RectangleWhich quadrilateral has: All sides equal, and opposite angles equal?
Trapezium
Rhombus
Kite
RectangleKaren says every equilateral triangle is acute. Is this true?
Find the number of lines of symmetry of a circle.
A. 0
B. 4
C. 2
D. InfiniteThe endpoints of a diameter of a circle are located at (5,9) and (11, 17). What is the equation of the circle?
What is the number of lines of symmetry in a scalene triangle?
A. 0
B. 1
C. 2
D. 3How many diagonals does a rectangle has?
A quadrilateral whose diagonals are unequal, perpendicular and bisect each other is called a.
A. rhombus
B. trapezium
C. parallelogram