To draw: The conclusion and internet the decision.
Cabiolab
Answered question
2020-11-01
Answer & Explanation
Clelioo
Skilled2020-11-02Added 88 answers
Given:
A professor is concerned that the two sections of college algebra that he teaches are not performing at the same level. To test his claim, he looks at the mean exam score for a random sample of students from each of his classes. In Class1, the mean exam for 12 students is 78.7 with a standard deviation of 6.5. In Class 2, the mean exam core for 15 students is 81.1 with a standard deviation of 7.4. Assume that the population variances are equal
Procedure:
Rejection Regions for hypothesis tests for two population means. Reject the null hypothesis,
The alternative hypothesis contains “
It is given that
The calculated value of the test statistic -0.88295 is less than the critical value, it does fall in the rejection region. The null hypothesis is rejected because
Thus, it is concluded that there is sufficient evidence at the 0.05 level of significance to support the claim that two sections of college algebra that he teaches are performing at the same level.
New Questions in College algebra
Given that 1 and l , evaluate each of the following. Hint: use the properties of logarithms to rewrite the given logarithm in terms of the the logarithms of 3 and 5.
The equation above shows how temperature F, measured in degrees Fahrenheit, relates to a temperature C, measured in degrees Celsius. Based on the equation, which of the following must be true?
1. A temperature increase of 1 degree Fahrenheit is equivalent to a temperature increase of degree Celsius.
2. A temperature increase of 1 degree Celsius is equivalent to a temperature increase of 1.8 degrees Fahrenheit.
3. A temperature increase of degree Fahrenheit is equivalent to a temperature increase of 1 degree Celsius.
A) I only
B) II only
C) III only
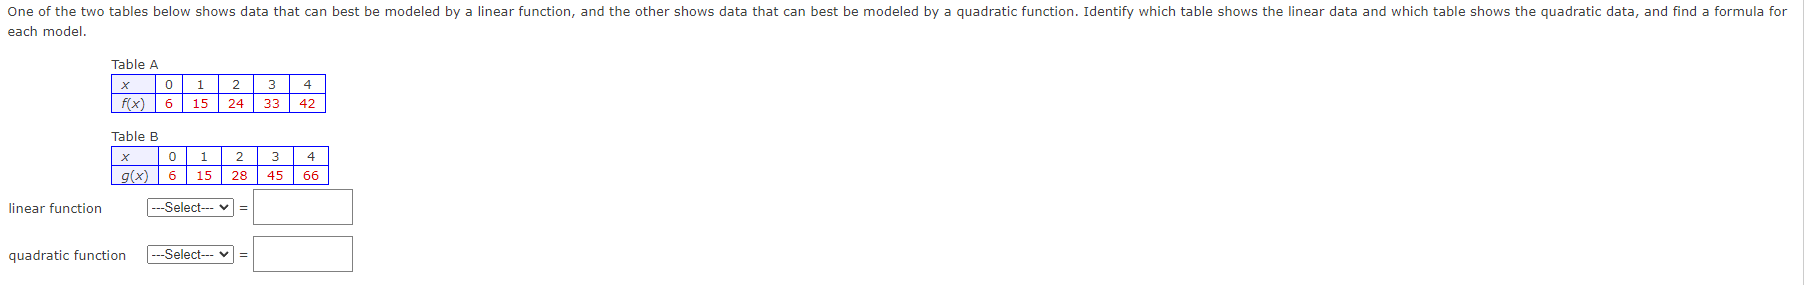
D) I and II onlyOne of the two tables below shows data that can best be modeled by a linear function, and the other shows data that can best be modeled by a quadratic function. Identify which table shows the linear data and which table shows the quadratic data, and find a formula for each model.

One of the two tables below shows data that can best be modeled by a linear function, and the other shows data that can best be modeled by a quadratic function. Identify which table shows the linear data and which table shows the quadratic data, and find a formula for each model.
if -x^2+y^2=4-4x^2y then find the equations of all tangent lines to the curve when y=-5
Find the formula for an exponential function that passes through (0,6) and (2,750)

Use the given conditions to write an equation for the line in point-slope form and general form. Passing through (8,-4) and perpendicular to the line whose equation is
x-6y-5=0
Use the given conditions to write an equation for the line in point-slope form and general form. Passing through (8,-4) and perpendicular to the line whose equation is x-6y-5=0
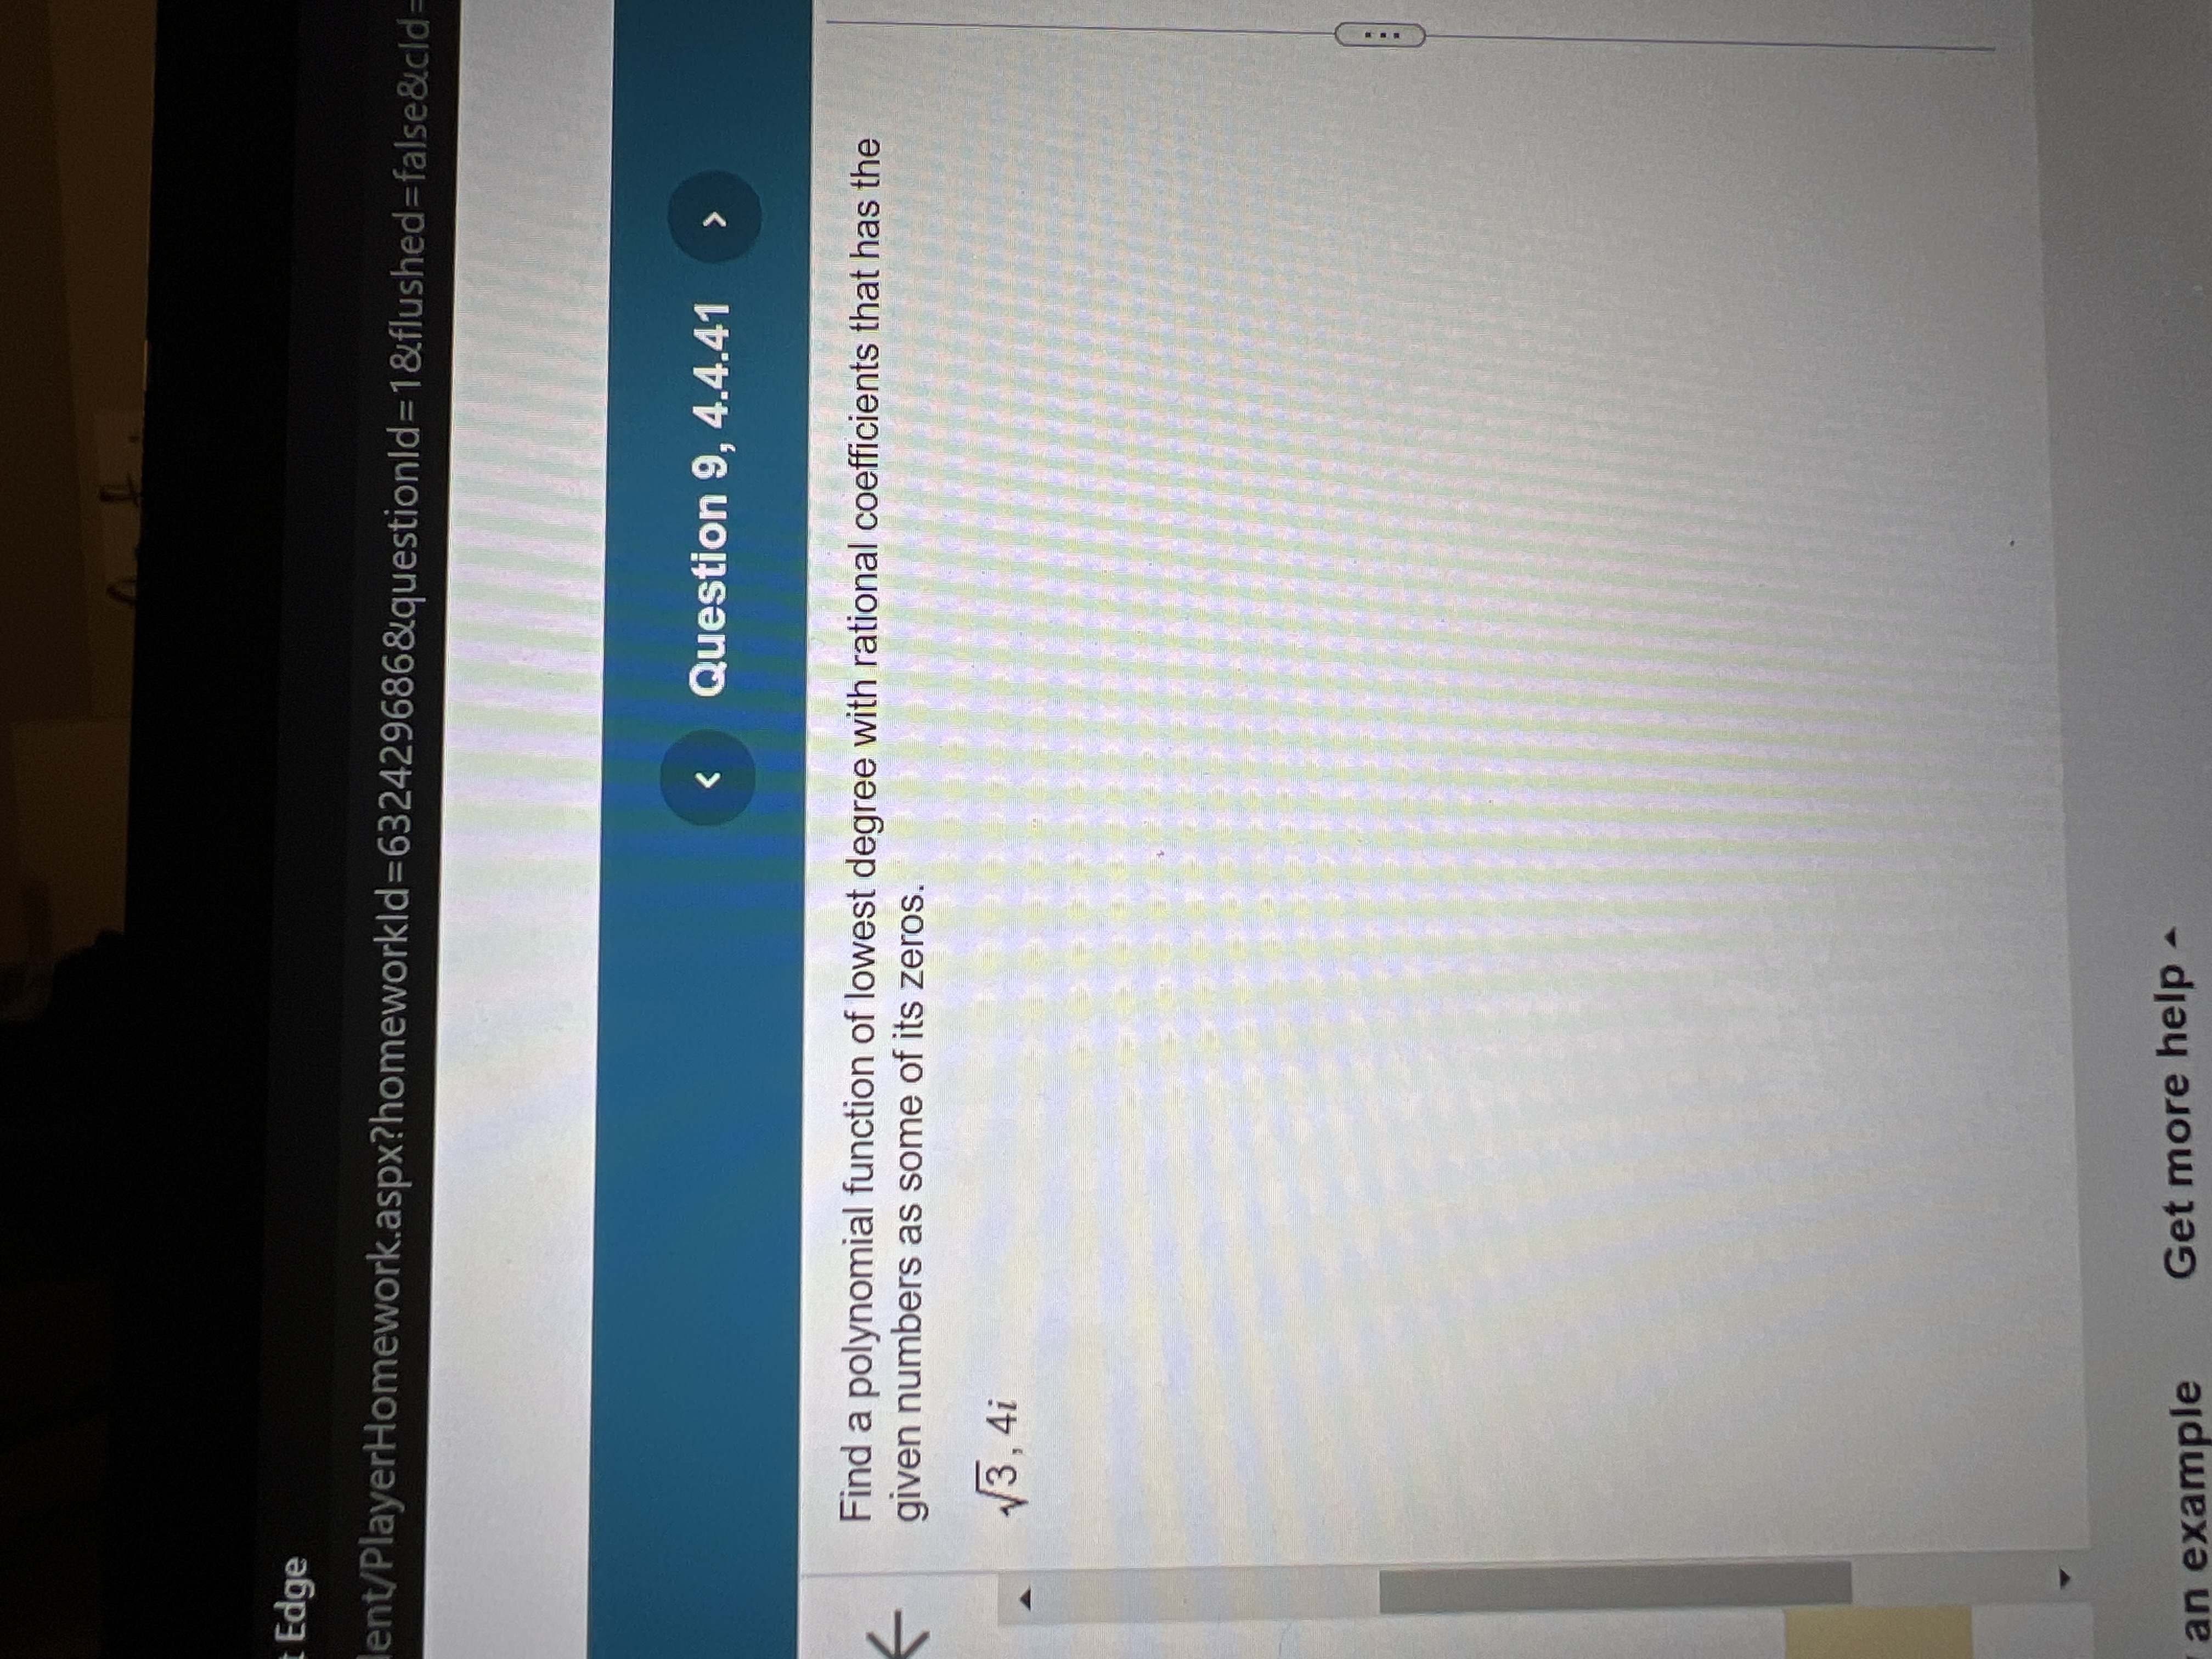
A polynomial of a degree 5 had rational coefficients and the zeros , and
What are the missing zeros?
Let R be the relation on the set {0, 1, 2, 3} containing the ordered pairs (0, 1),(1, 1),(1, 2),(2, 0),(2, 2),(3, 0). Find reflexive, symmetric and transitive closure of R.
A baseball team plays in a stadium that holds 70,000 spectators. With the ticket price at $11, the average attendance has been 29,000. When the price dropped to $10, the average attendance rose to 35,000. Assuming the demand function, p(x), is linear, find p(x), where x is the number of the spectators. Write p(x) in slope-intercept form.

To break even in a manufacturing business, income or revenue R must equal the cost of production the letter C. The cost the letter C to produce X skateboards is the letter C = 108+21X. The skateboards are sold wholesale for $25 each, so revenue the letter R is given by the letter R = 25 X. Find how many skateboards the manufacture needs to produce and sell to break even. (Hint: set the cost expression equal to the revenue expression and solve for X.)