Given linear equation y = -3x a. find the y-intercept and slope. b. determine whether the line slopes upward, slopes downward, or is horizontal, without graphing the equation. c. use two points to graph the equation.
cistG
Answered question
2020-12-06
a. find the y-intercept and slope.
b. determine whether the line slopes upward, slopes downward, or is horizontal, without graphing the equation.
c. use two points to graph the equation.
Answer & Explanation
Nathanael Webber
Skilled2020-12-07Added 117 answers
y-intercept
Slope
(b) When slope is positive then line slope will show upward in a graph. When slope is negative then line slope will show downward in a graph.
Here, slope is -3 which is negative. Hence, line slopes will be downwards in a graph.
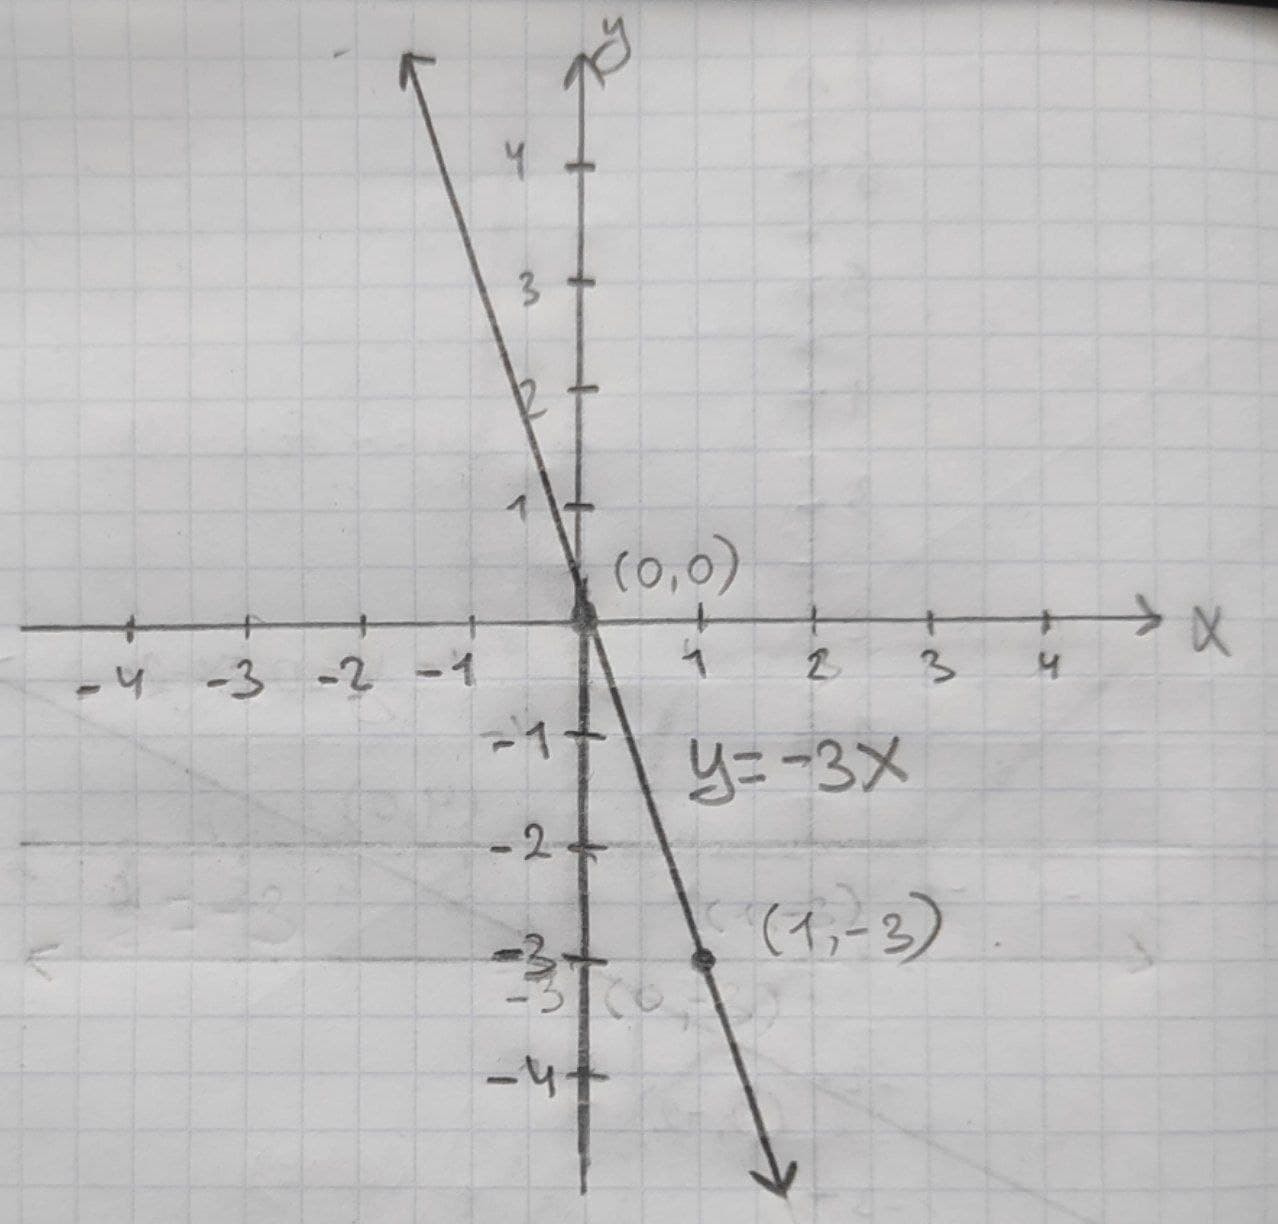
(c) Linear regression equation is, y = -3x
Suppose x = 0 then y =0
If x = 1 then y = -3
Therefore, two points are (0,0) and (1,-3)
Following is the graph for above two points:
New Questions in Algebra I
Find the volume V of the described solid S
A cap of a sphere with radius r and height h.
V=??
Whether each of these functions is a bijection from R to R.
a)
b)
c)
?In how many different orders can five runners finish a race if no ties are allowed???
State which of the following are linear functions?
a.
b.
c.
d.Three ounces of cinnamon costs $2.40. If there are 16 ounces in 1 pound, how much does cinnamon cost per pound?
A square is also a
A)Rhombus;
B)Parallelogram;
C)Kite;
D)none of theseWhat is the order of the numbers from least to greatest.
,
,
,
Write the numerical value of
Solve for y. 2y - 3 = 9
A)5;
B)4;
C)6;
D)3How to graph ?
How to graph using a table?
simplify
How to find the vertex of the parabola by completing the square ?
There are 60 minutes in an hour. How many minutes are there in a day (24 hours)?
Write 18 thousand in scientific notation.