What is the graph of f(x)=x^2?
dedica66em
Answered question
2021-12-18
Answer & Explanation
Jeremy Merritt
Beginner2021-12-19Added 31 answers
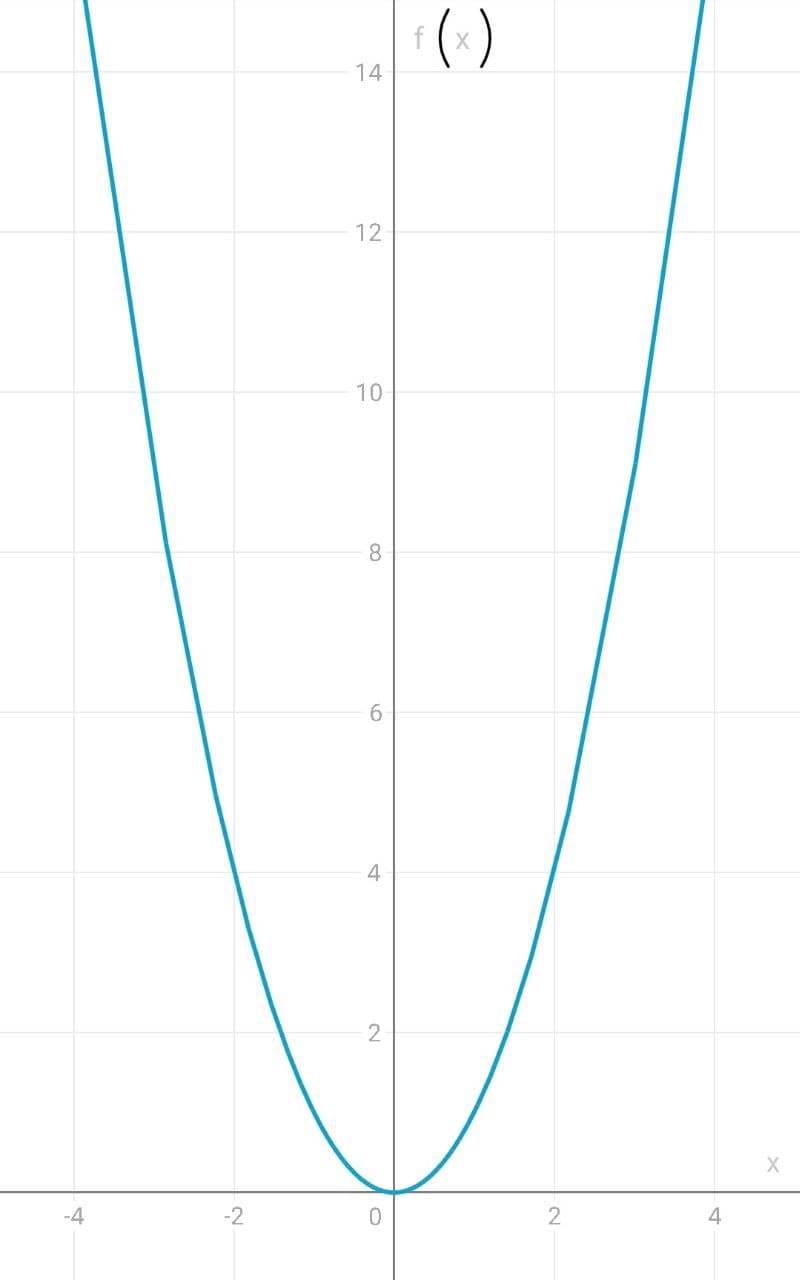
One of the ways to graph this is to use plug in a few x-values and get an idea of the shape. Since the x values keep getting squared, there is an exponential increase on either side of the y-axis. You can see this by plugging in a few values:
When
The same holds true for negative x-values to the left of the y-axis since a negative value squared is positive. For example,
Linda Birchfield
Beginner2021-12-20Added 39 answers
nick1337
Expert2021-12-28Added 777 answers
New Questions in Algebra I
Find the volume V of the described solid S
A cap of a sphere with radius r and height h.
V=??
Whether each of these functions is a bijection from R to R.
a)
b)
c)
?In how many different orders can five runners finish a race if no ties are allowed???
State which of the following are linear functions?
a.
b.
c.
d.Three ounces of cinnamon costs $2.40. If there are 16 ounces in 1 pound, how much does cinnamon cost per pound?
A square is also a
A)Rhombus;
B)Parallelogram;
C)Kite;
D)none of theseWhat is the order of the numbers from least to greatest.
,
,
,
Write the numerical value of
Solve for y. 2y - 3 = 9
A)5;
B)4;
C)6;
D)3How to graph ?
How to graph using a table?
simplify
How to find the vertex of the parabola by completing the square ?
There are 60 minutes in an hour. How many minutes are there in a day (24 hours)?
Write 18 thousand in scientific notation.