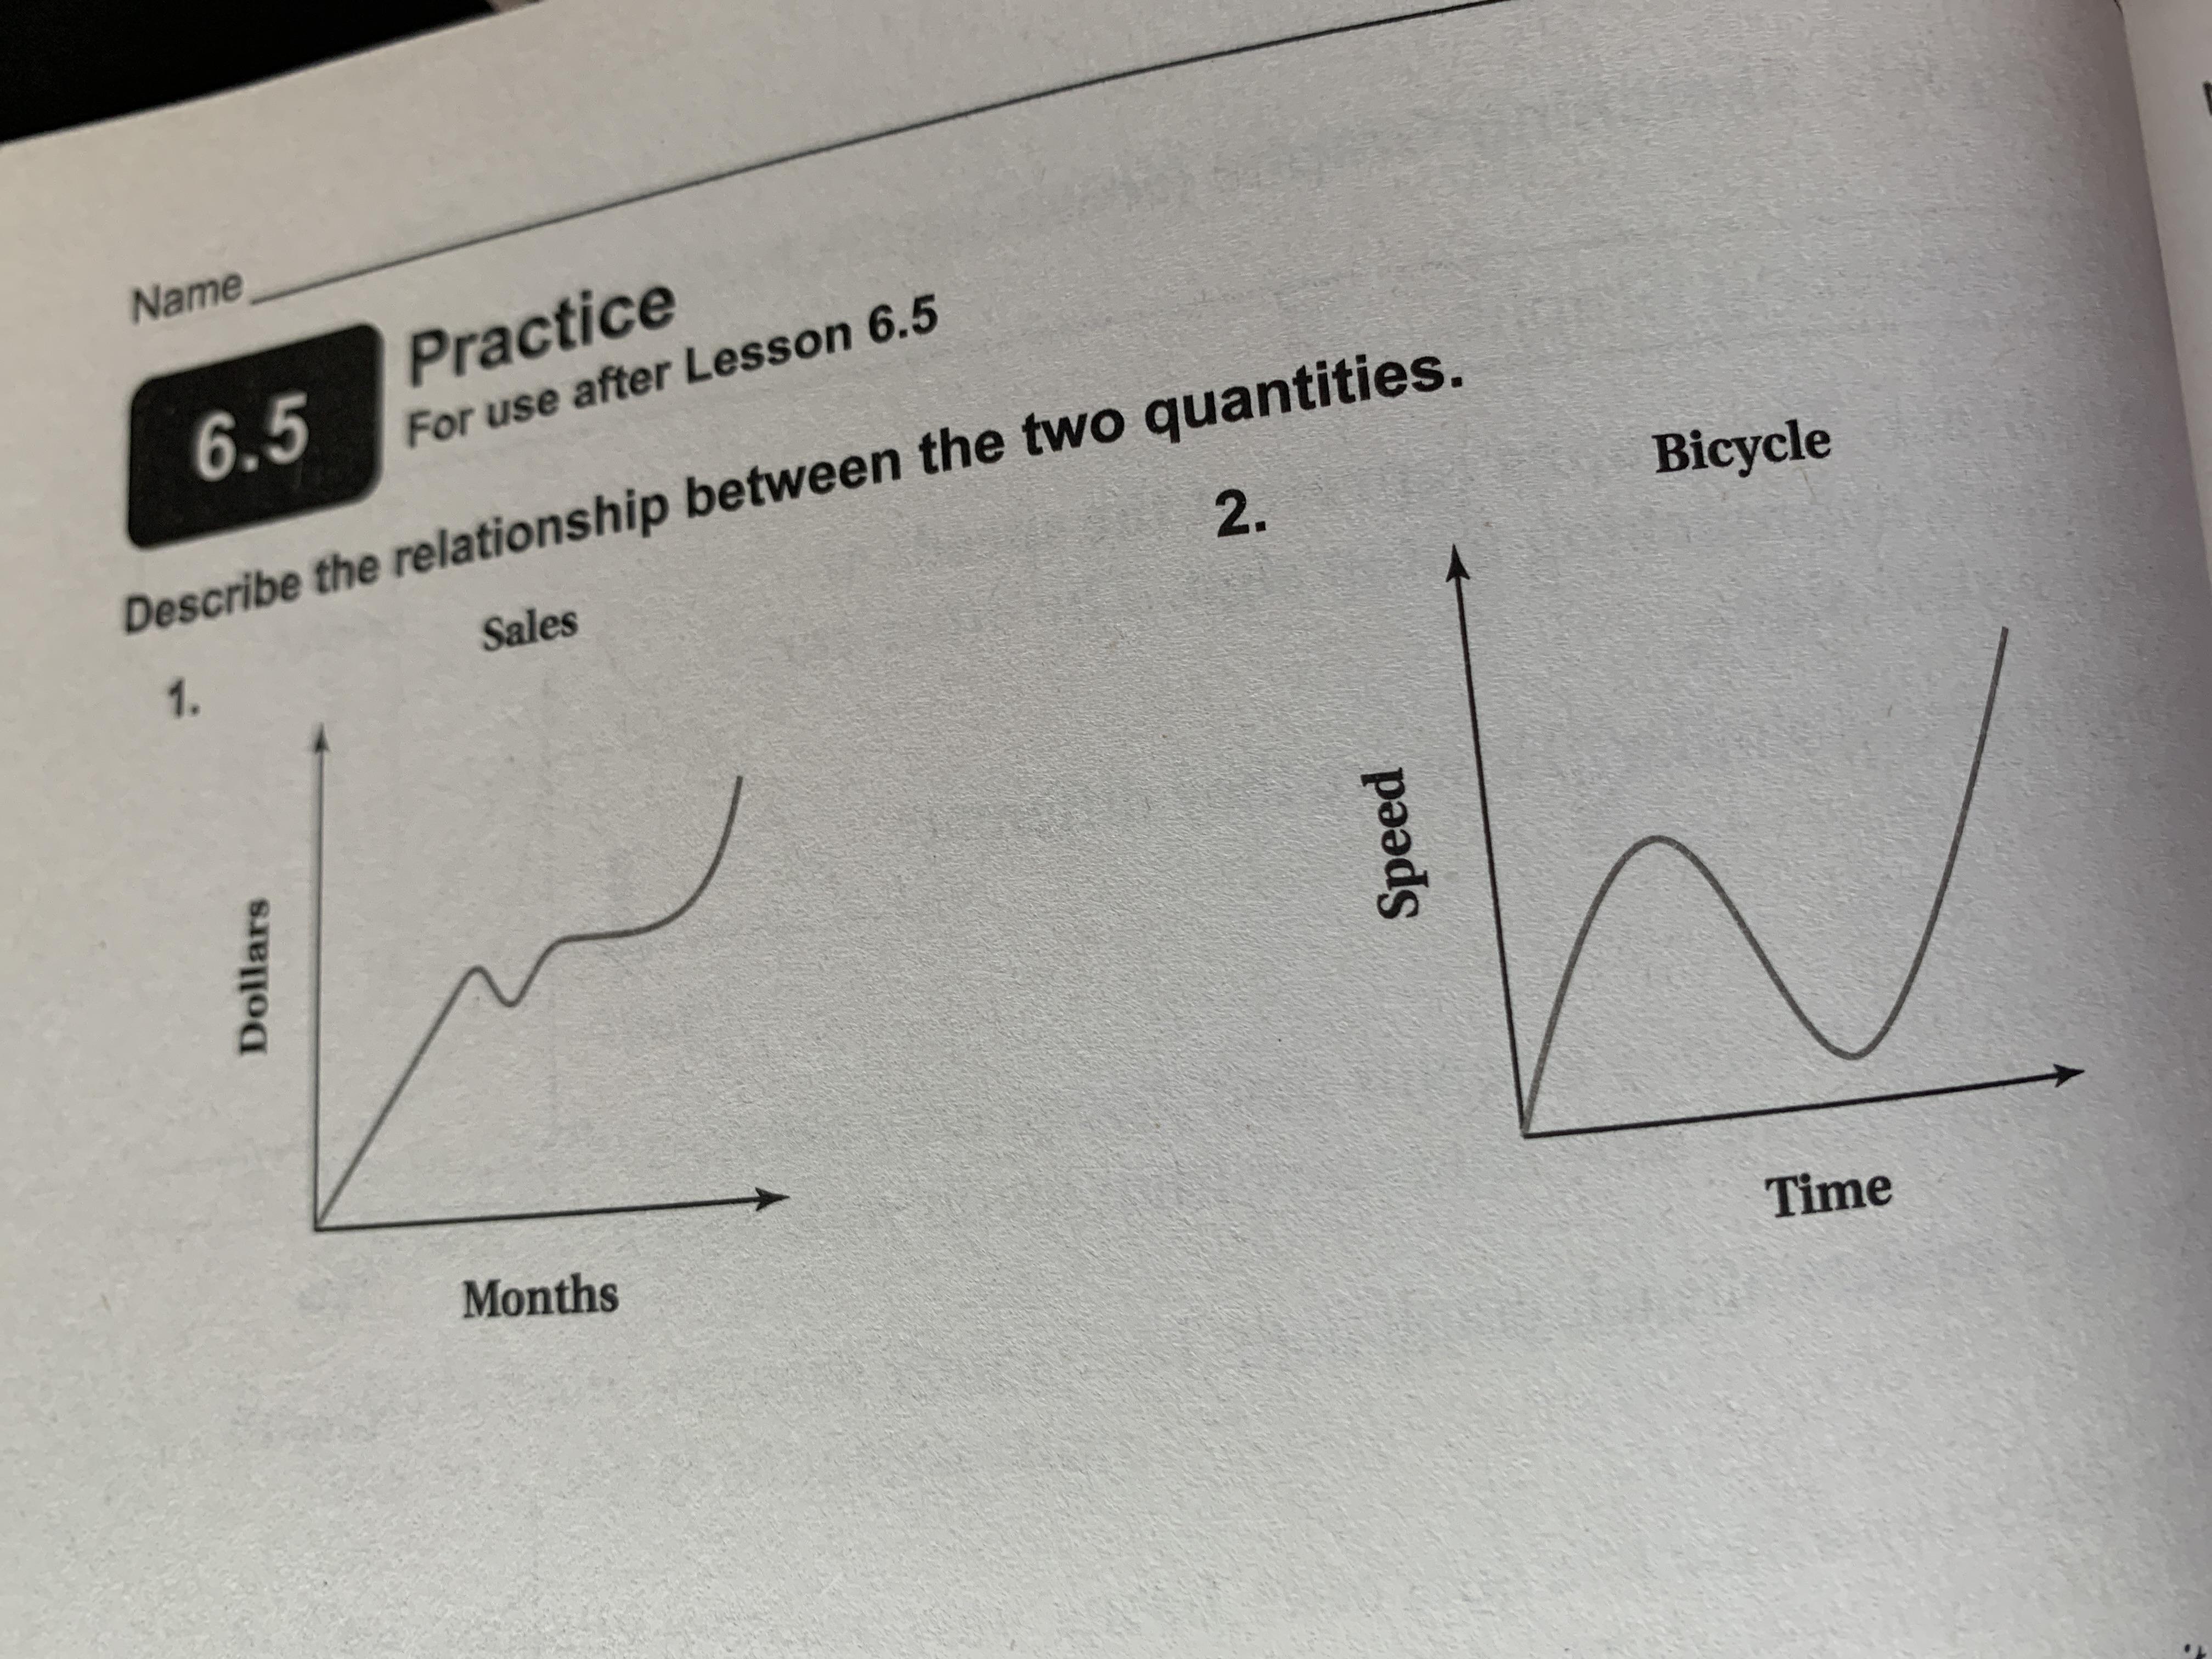
Describe the relationship between the two quantities.1 [Graph] 2 [Graph]
waigaK
Answered question
2021-03-18
Describe the relationship between the two quantities.
Answer & Explanation
Mitchel Aguirre
Skilled2021-03-19Added 94 answers
As can be seen from the graph, the relationship between x (months) and y (dollars) is mostly positive, since yy increases with x. In another words, sales grew over the months.
We say mostly, because for some values of x, y decreases. So, in some months sales were weaker than in the previous one and this is evident from the part where graph has negative slope.
But, in general, we can say that sales are growing over the months.
2.The given graph shows the speed of the bicycle with respect to time.
Notice that there is not strong relationship between speen and time. To be precise, speed does not depend on time.
At the beginning, as the graph has positive slope, there was acceleration (when xx goes up, yy goes up too ).
But after some time, the velocity began to fall. For larger values of x, there were smaller values of y which is shown by the negative slope of the direction. And after that, there was acceleration stronger than it was at the beginning of the ride.
New Questions in Algebra I
Find the volume V of the described solid S
A cap of a sphere with radius r and height h.
V=??
Whether each of these functions is a bijection from R to R.
a)
b)
c)
?In how many different orders can five runners finish a race if no ties are allowed???
State which of the following are linear functions?
a.
b.
c.
d.Three ounces of cinnamon costs $2.40. If there are 16 ounces in 1 pound, how much does cinnamon cost per pound?
A square is also a
A)Rhombus;
B)Parallelogram;
C)Kite;
D)none of theseWhat is the order of the numbers from least to greatest.
,
,
,
Write the numerical value of
Solve for y. 2y - 3 = 9
A)5;
B)4;
C)6;
D)3How to graph ?
How to graph using a table?
simplify
How to find the vertex of the parabola by completing the square ?
There are 60 minutes in an hour. How many minutes are there in a day (24 hours)?
Write 18 thousand in scientific notation.