Graph the solution set for the system of linear inequalities x>=3 y>=-1
Maiclubk
Answered question
2020-11-05
Answer & Explanation
opsadnojD
Skilled2020-11-06Added 95 answers
Auxiliary equations are x=3 and y=-1
We start by graphing those lines.
x=3 will be a vertical line passing through x=3
And y=-1 is a horizontal line passing through y=-1
After that, shade the necessary inequalities.
For shade the right side of x=3
For we shade above y=-1.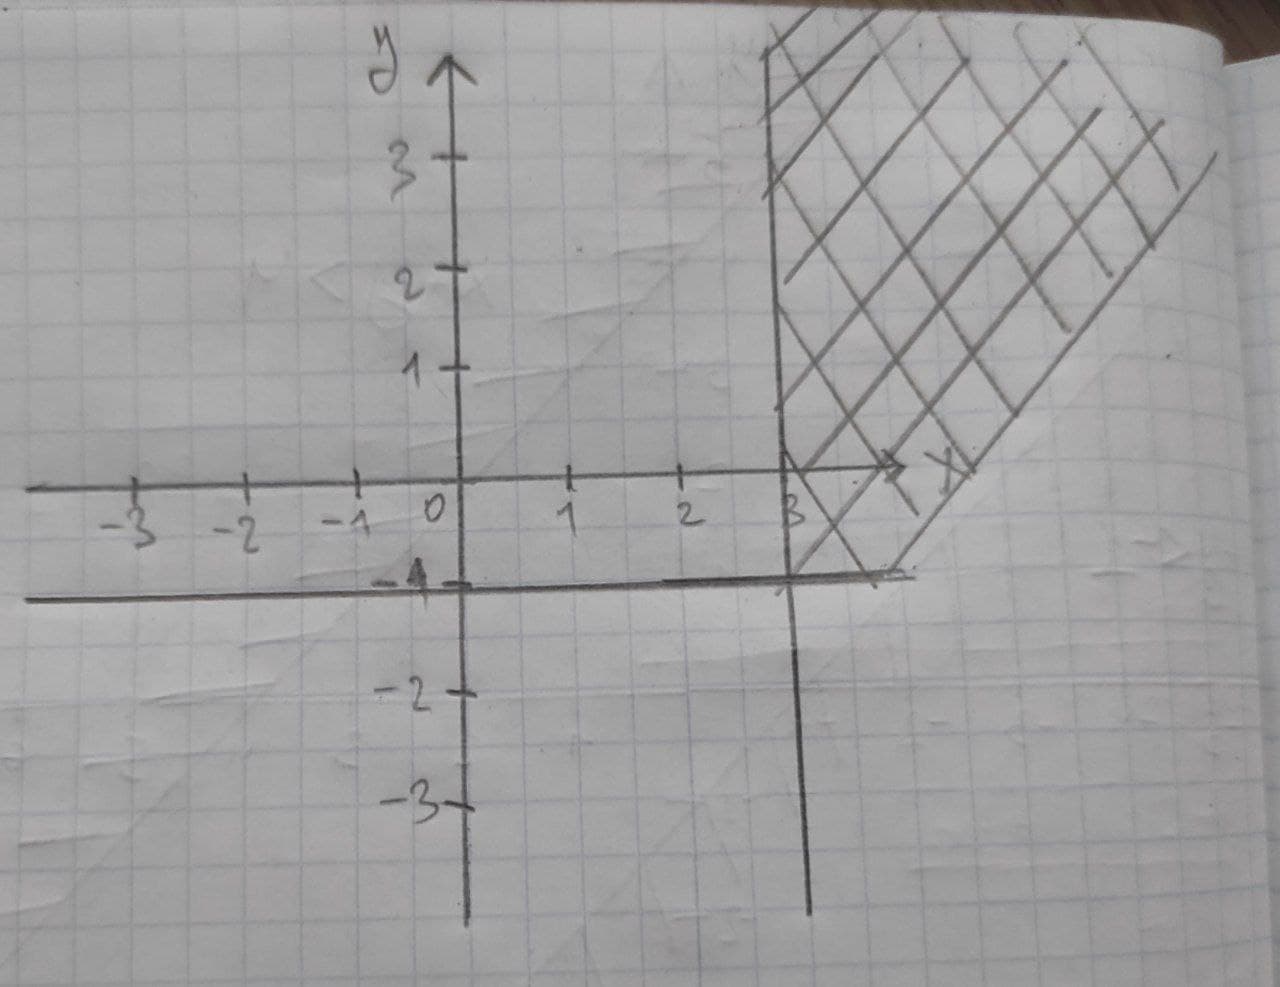
New Questions in Algebra I
Find the volume V of the described solid S
A cap of a sphere with radius r and height h.
V=??
Whether each of these functions is a bijection from R to R.
a)
b)
c)
?In how many different orders can five runners finish a race if no ties are allowed???
State which of the following are linear functions?
a.
b.
c.
d.Three ounces of cinnamon costs $2.40. If there are 16 ounces in 1 pound, how much does cinnamon cost per pound?
A square is also a
A)Rhombus;
B)Parallelogram;
C)Kite;
D)none of theseWhat is the order of the numbers from least to greatest.
,
,
,
Write the numerical value of
Solve for y. 2y - 3 = 9
A)5;
B)4;
C)6;
D)3How to graph ?
How to graph using a table?
simplify
How to find the vertex of the parabola by completing the square ?
There are 60 minutes in an hour. How many minutes are there in a day (24 hours)?
Write 18 thousand in scientific notation.