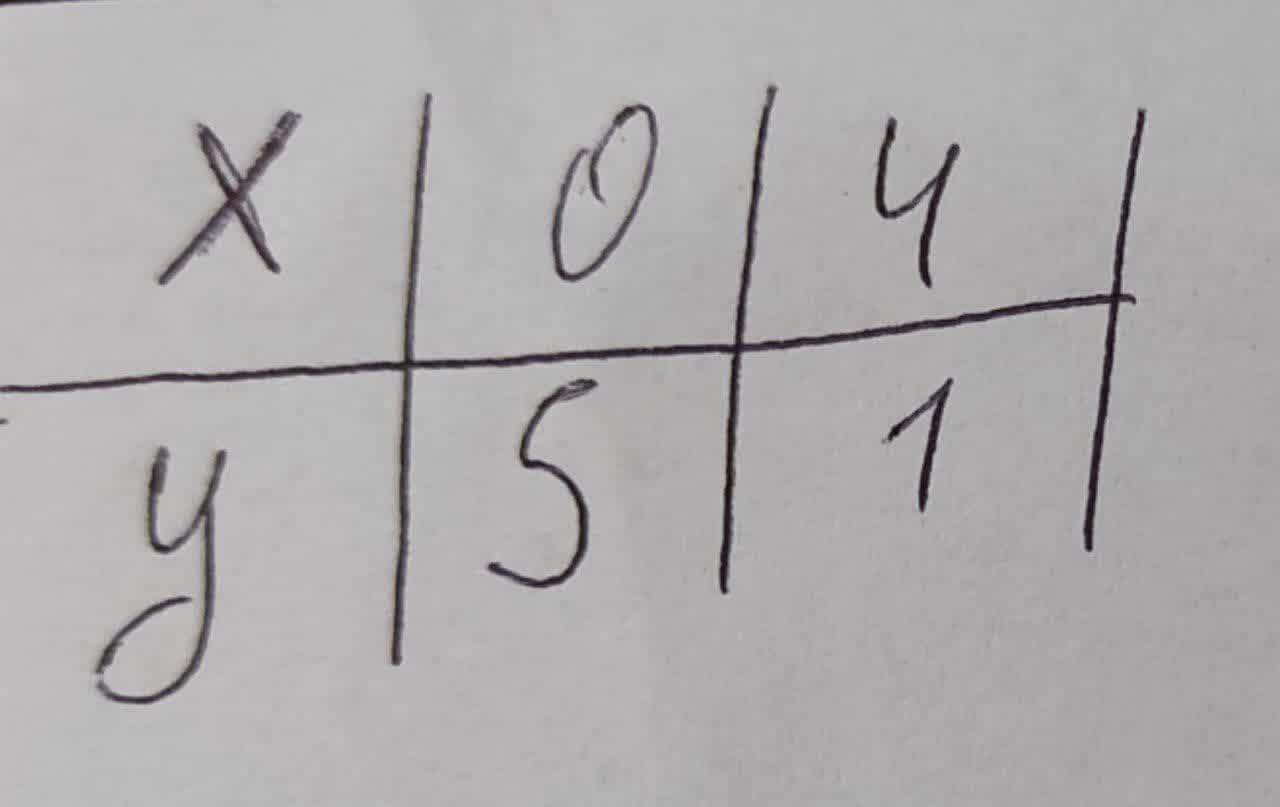
Find Expontntial Model that fits the points shown in the graph of table01510102841.jpg
Anish Buchanan
Answered question
2020-12-17
Find Expontntial Model that fits the points shown in the graph of table
Answer & Explanation
odgovoreh
Skilled2020-12-18Added 107 answers
Let us consider the following exponential model
Now, with given point (0,5), the equation becomes
Therefore,
With the given point (4,1) and
Dividing both sides by 5
Taking natural logarithm to the base e
Using the inverse property
Therefore,
Hence, the equation of the curve with
New Questions in Algebra II
Which operation could we perform in order to find the number of milliseconds in a year??
Tell about the meaning of Sxx and Sxy in simple linear regression,, especially the meaning of those formulas
Is the number 7356 divisible by 12? Also find the remainder.
A) No
B) 0
C) Yes
D) 6What is a positive integer?
Determine the value of k if the remainder is 3 given
Is a prime number?
What is the square root of ?
Is the sum of two prime numbers is always even?
149600000000 is equal to
A)
B)
C)
D)Find the value of to the base ?
What is the square root of 3 divided by 2 .
write as an equivalent expression using a fractional exponent.
simplify
What is the square root of