Graph the solution set of each system if inequalities. X is greater than or = 0 X+Y is less than or equal to 4 2x+y is less than or equal to 5
alesterp
Answered question
2021-01-31
X is greater than or = 0
X+Y is less than or equal to 4
2x+y is less than or equal to 5
Answer & Explanation
Bella
Skilled2021-02-01Added 81 answers
For the inequalities we make auxiliary equations.
x=0 ,x+y=4, 2x+y=5
x=0
x+y=4
2x+y=5
Make table for the equations and graph: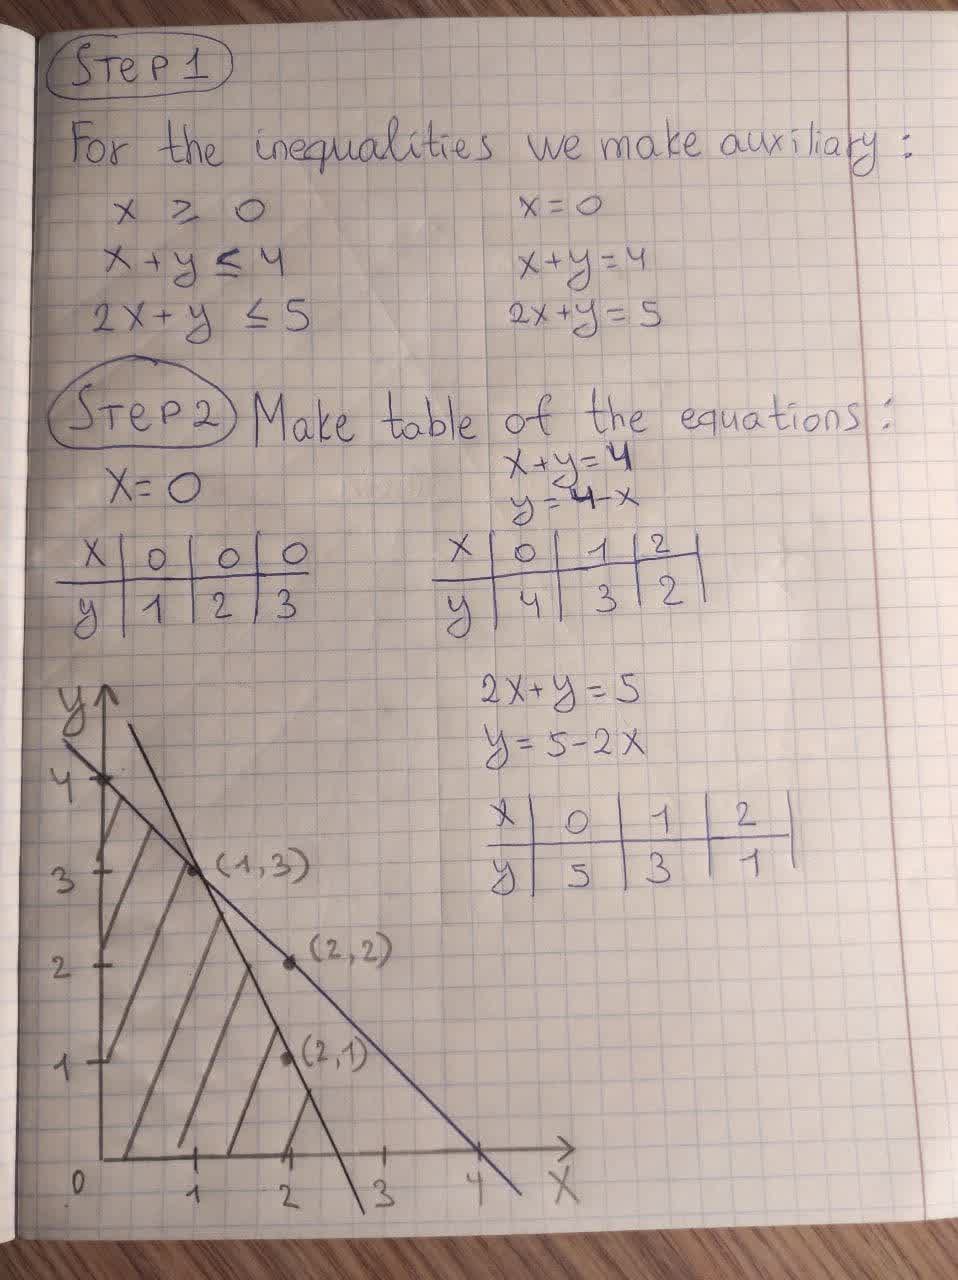
Then shade the regions according to the inequalities.
For , shade the right side of x=0
For , shadetowards (0,0) because x=0, y=0 satisfies the inequality.
For , shade towards (0,0) because x=0, y=0 satisfies the inequality.
So, the common region is the shaded region in black.
New Questions in Algebra I
Find the volume V of the described solid S
A cap of a sphere with radius r and height h.
V=??
Whether each of these functions is a bijection from R to R.
a)
b)
c)
?In how many different orders can five runners finish a race if no ties are allowed???
State which of the following are linear functions?
a.
b.
c.
d.Three ounces of cinnamon costs $2.40. If there are 16 ounces in 1 pound, how much does cinnamon cost per pound?
A square is also a
A)Rhombus;
B)Parallelogram;
C)Kite;
D)none of theseWhat is the order of the numbers from least to greatest.
,
,
,
Write the numerical value of
Solve for y. 2y - 3 = 9
A)5;
B)4;
C)6;
D)3How to graph ?
How to graph using a table?
simplify
How to find the vertex of the parabola by completing the square ?
There are 60 minutes in an hour. How many minutes are there in a day (24 hours)?
Write 18 thousand in scientific notation.