Graph the feasible region for the system of inequalities y>4x-1y<-2x+3
DofotheroU
Answered question
2021-03-07
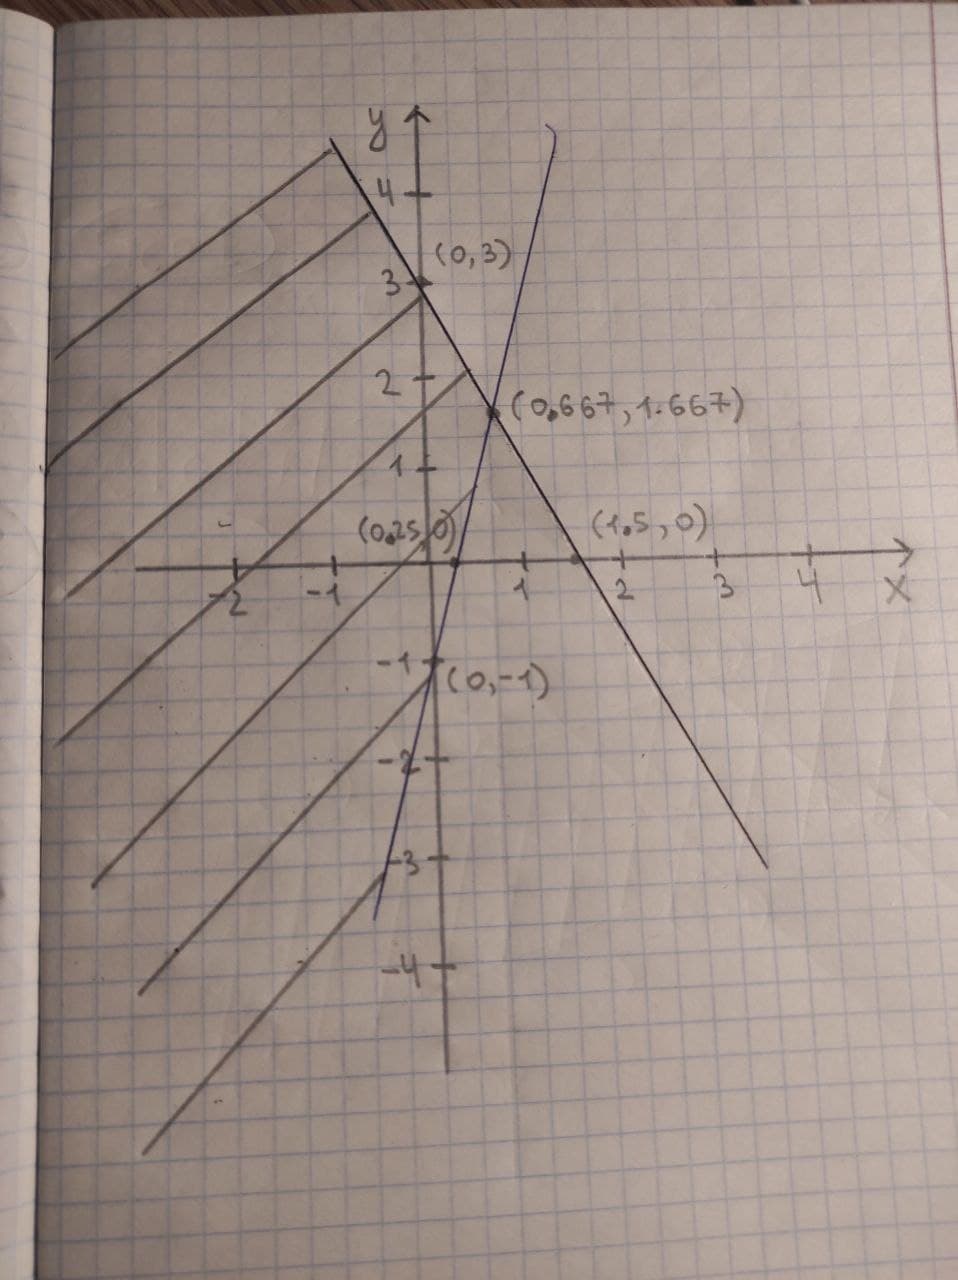
Graph the feasible region for the system of inequalities
Answer & Explanation
Ezra Herbert
Skilled2021-03-08Added 99 answers
y>4x-1
y=4x-1 (1)
y<-2x+3
y=-2x+3 (2)
Now, check whether (0, 0) satisfies the inequalities.
If origin satisfies the inequality then the region containing origin is the region for inequality or vice-versa.
y>4x-1
For x=0:
4x-1=(4*0)-1=-1
As 0>-1, so y>4x-1 its true for (0,0).
Again, for x=0:
-2x+3=(-2*0)+3=3
As 0<3, so y<4x-1 is true for (0,0)
Step 2 Plot the region of inequality and the region satisfying both the inequalities is the feasible region. The shaded region is the feasible region.
New Questions in Algebra I
Find the volume V of the described solid S
A cap of a sphere with radius r and height h.
V=??
Whether each of these functions is a bijection from R to R.
a)
b)
c)
?In how many different orders can five runners finish a race if no ties are allowed???
State which of the following are linear functions?
a.
b.
c.
d.Three ounces of cinnamon costs $2.40. If there are 16 ounces in 1 pound, how much does cinnamon cost per pound?
A square is also a
A)Rhombus;
B)Parallelogram;
C)Kite;
D)none of theseWhat is the order of the numbers from least to greatest.
,
,
,
Write the numerical value of
Solve for y. 2y - 3 = 9
A)5;
B)4;
C)6;
D)3How to graph ?
How to graph using a table?
simplify
How to find the vertex of the parabola by completing the square ?
There are 60 minutes in an hour. How many minutes are there in a day (24 hours)?
Write 18 thousand in scientific notation.