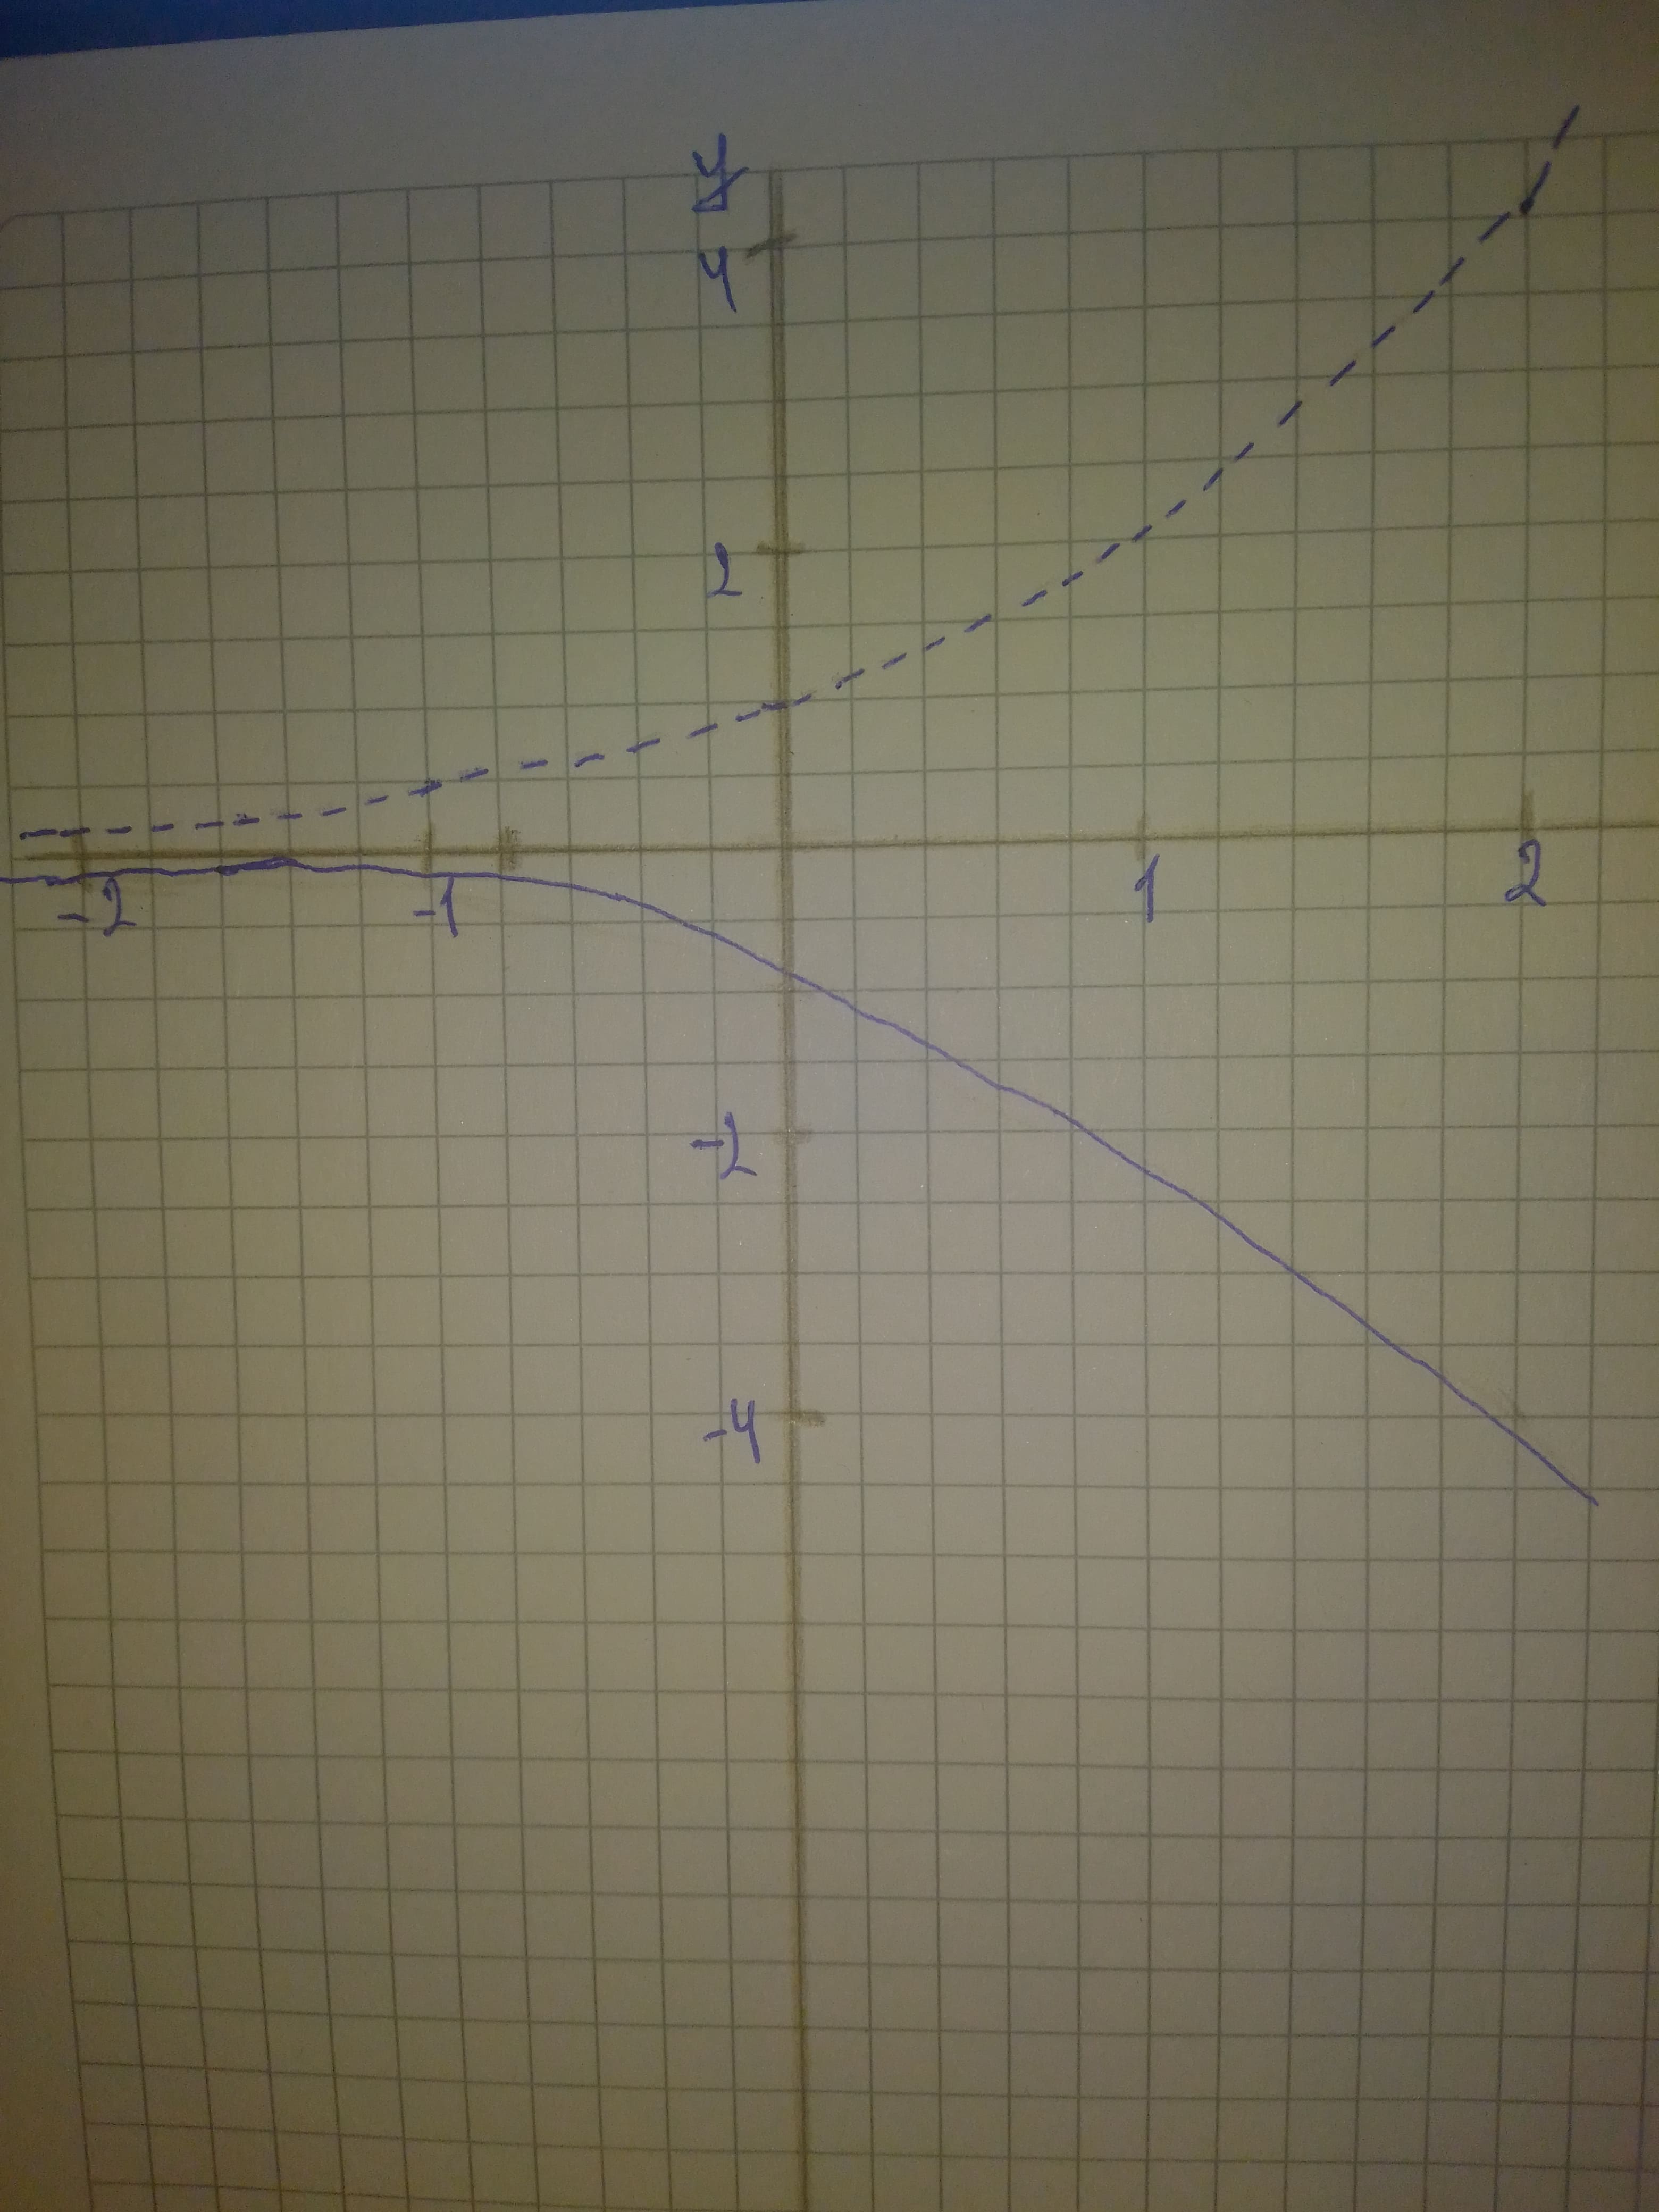
Begin by graphing f(x)=2^{x} Then use transformations of this graph to graph the given function. Be sure to graph and give equations of the asymptotes. Use the graphs to determine each function's domain and range. If applicable, use a graphing utility to confirm your hand-drawn graphs. g(x)=-2^{x}
chillywilly12a
Answered question
2021-02-08
Then use transformations of this graph to graph the given function. Be sure to graph and give equations of the asymptotes. Use the graphs to determine each functions
Answer & Explanation
Viktor Wiley
Skilled2021-02-09Added 84 answers
Step 1
Step 2
Graph of
The graph of
Its asymptote has equation
New Questions in Precalculus
Describe all solutions of Ax=0 in parametric vector form, where A is row equivalent to the given matrix
Find, correct to the nearest degree, the three angles of the triangle with the given vertices
A(1, 0, -1), B(3, -2, 0), C(1, 3, 3)Whether f is a function from Z to R if
?
a) .
b) .
c) .How to write the expression in radical form?
How to evaluate ?
What is the derivative of ?
How to verify the identity: ?
Find using the half-angle formula.
How to find the exact values of using the half-angle formula?
How to express the complex number in trigonometric form: 5-5i?
The solution set of is
How to find the angle between the vector and axis?
Find the probability of getting 5 Mondays in the month of february in a leap year.
How to find the inflection points for the given function ?
How do I find the value of sec(3pi/4)?