Step 1
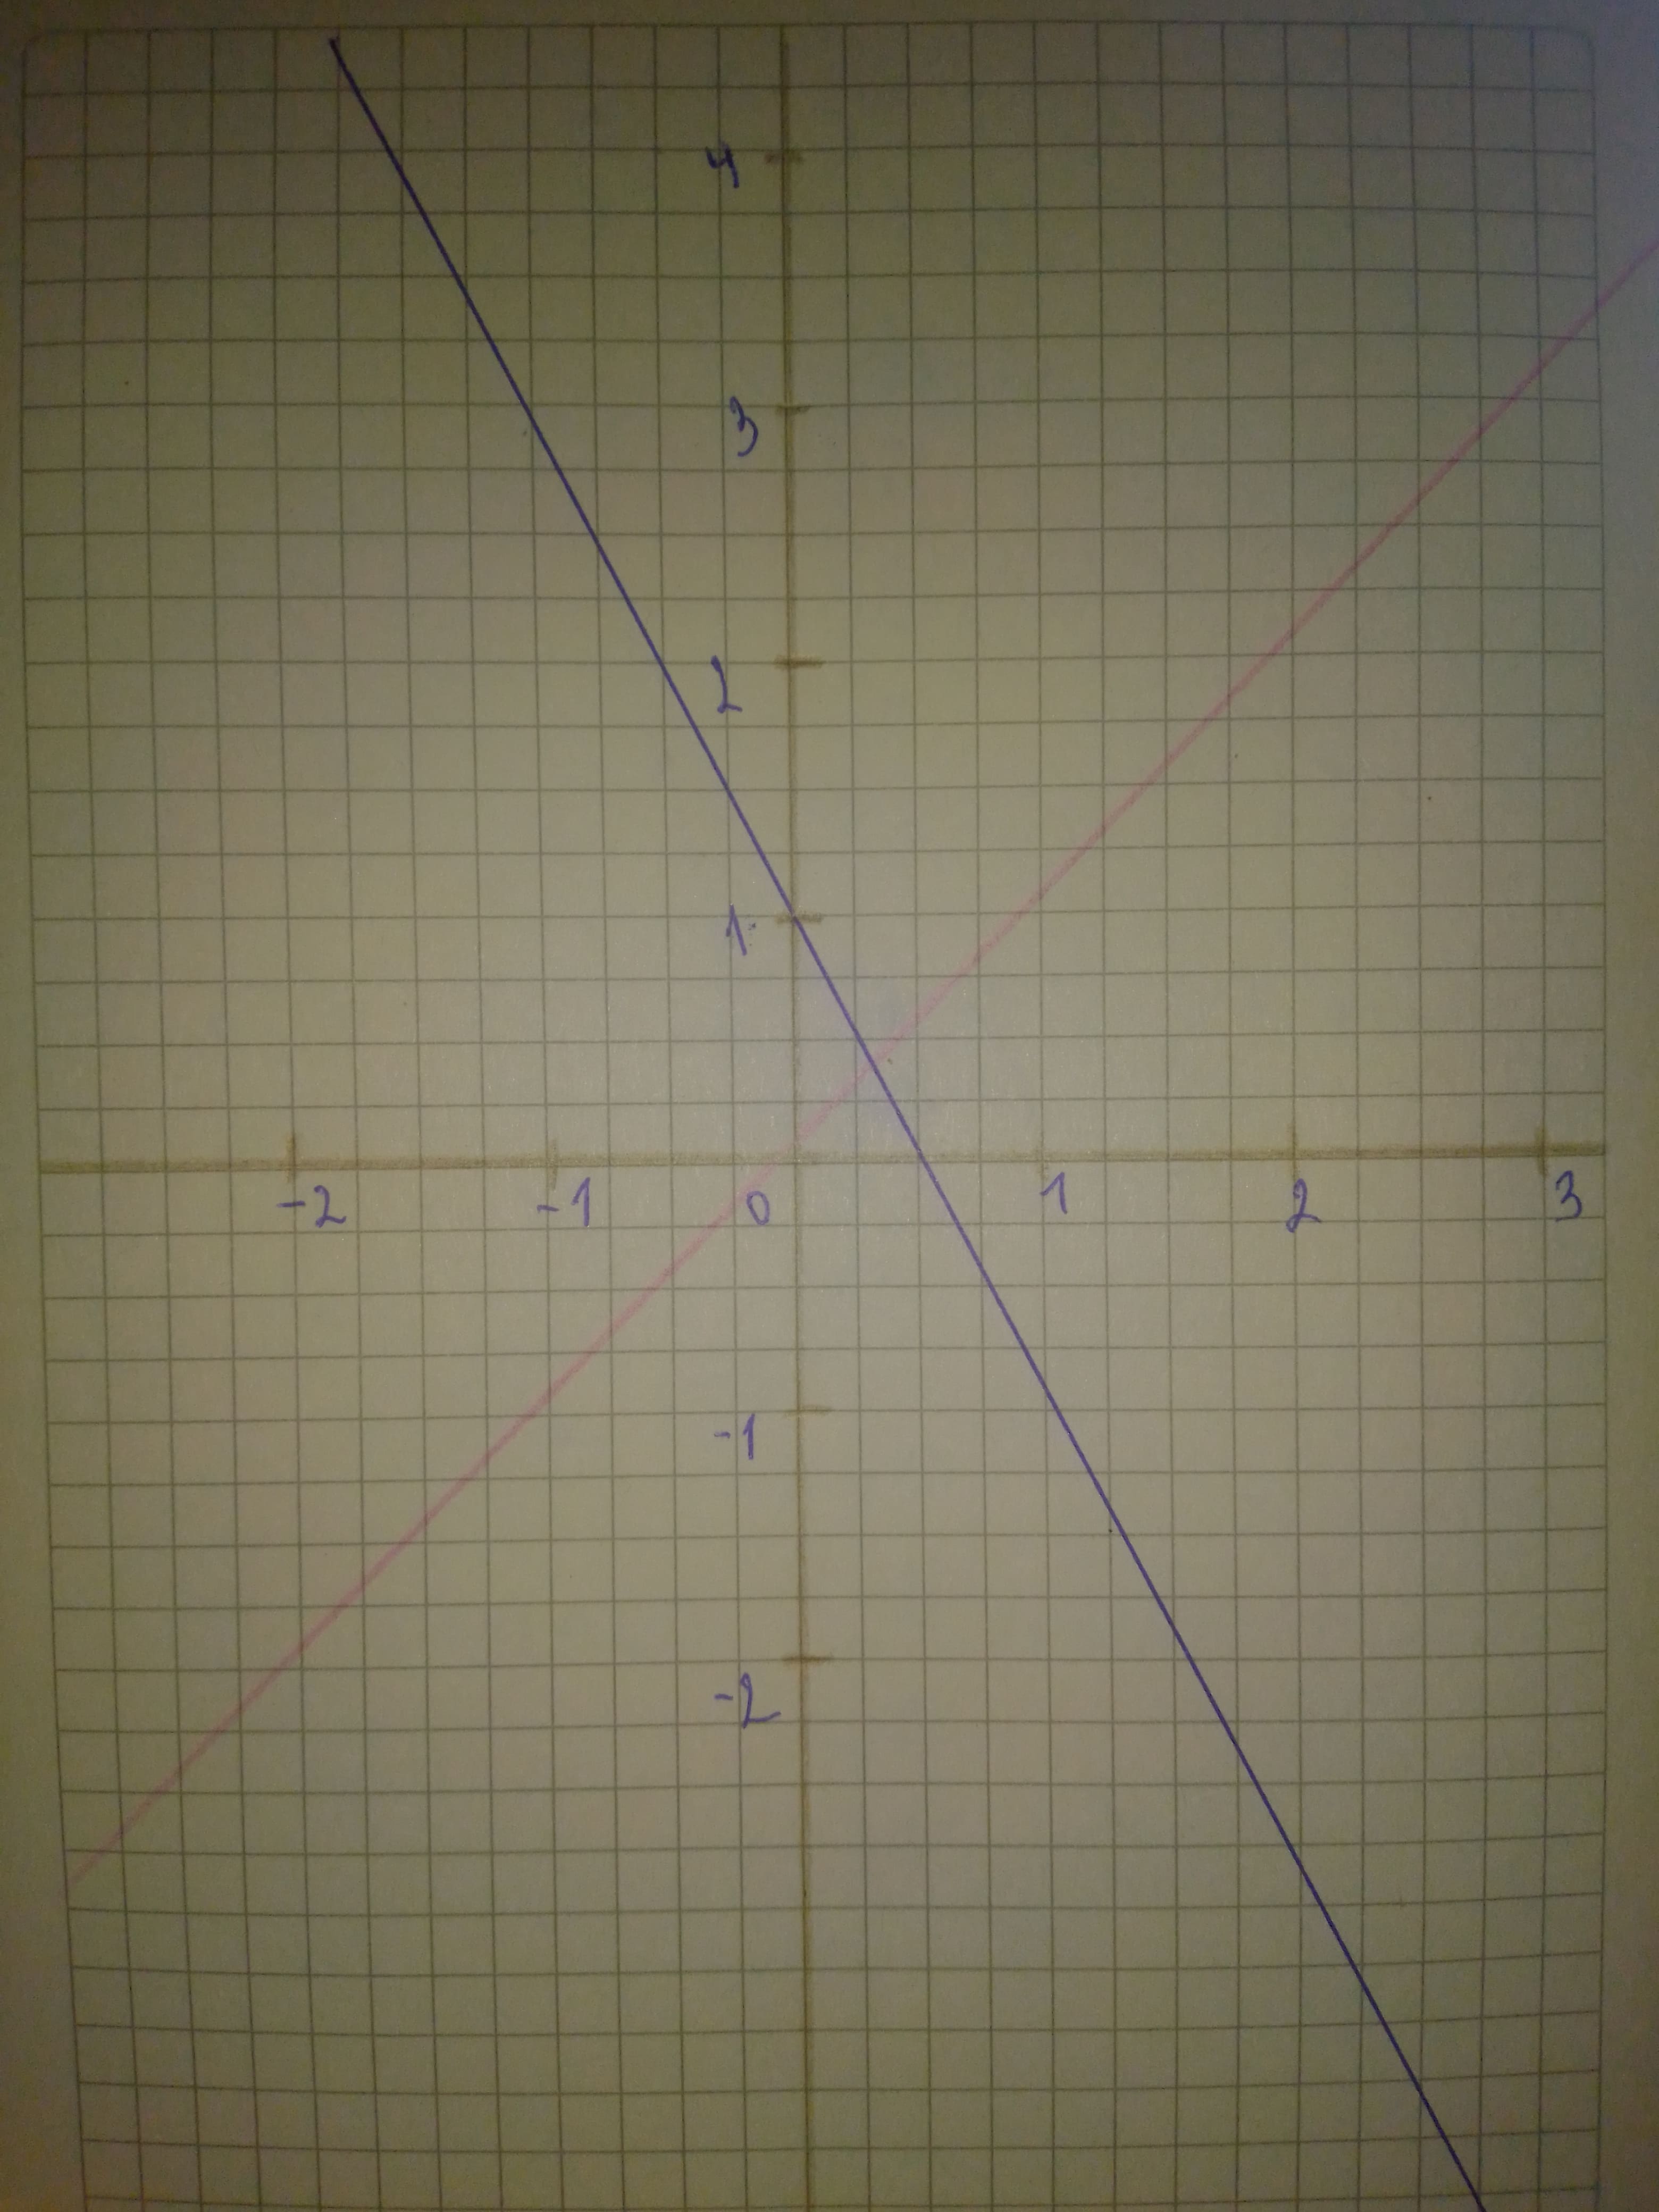
First graph function
Then, to obtain graph of function
-stretch vertically by a factor of 2
-reflect with respect to x-axis
-shift 1 unit upward
On graph: Red -
Blue -
Step 2
The exponential models describe the population of the indicated country, A, in millions, t years after 2010.Which country has the greatest growth rate? By what percentage is the population of that country increasing each year?
India,
Iraq,
Japan,
Russia,
The populations P (in thousands) of Luxembourg for the years 1999 through 2013 are shown in the table, where t represents the year, with
(a) Use the regression feature of a graphing utility to find a linear model for the data and to identify the coefficient of determination. Plot the model and the data in the same viewing window. (b) Use the regression feature of the graphing utility to find a power model for the data and to identify the coefficient of determination. Plot the model and the data in the same viewing window. (c) Use the regression feature of the graphing utility to find an exponential model for the data and to identify the coefficient of determination. Plot the model and the data in the same viewing window. (d) Use the regression feature of the graphing utility to find a logarithmic model for the data and to identify the coefficient of determination. Plot the model and the data in the same viewing window. (e) Which model is the best fit for the data? Explain. (f) Use each model to predict the populations of Luxembourg for the years 2014 through 2018. (g) Which model is the best choice for predicting the future population of Luxembourg? Explain. (h) Were your choices of models the same for parts (e) and (g)? If not, explain why your choices were different.
The table gives the midyear population of Japan, in thousands, from 1960 to 2010.
Use a calculator to fit both an exponential function and a logistic function to these data. Graph the data points and both functions, and comment on the accuracy of the models. [Hint: Subtract 94,000 from each of the population figures. Then, after obtaining a model from your calculator, add 94,000 to get your final model. It might be helpful to choose
The values of two functions, f and g, are given in a table. One, both, or neither of them may be exponential. Give the exponential models for those that are. (If an answer does not exist, enter DNE.)