The table gives the midyear population of Japan, in thousands, from 1960 to 2010.
Albarellak
Answered question
2021-01-31
The table gives the midyear population of Japan, in thousands, from 1960 to 2010.
Use a calculator to fit both an exponential function and a logistic function to these data. Graph the data points and both functions, and comment on the accuracy of the models. [Hint: Subtract 94,000 from each of the population figures. Then, after obtaining a model from your calculator, add 94,000 to get your final model. It might be helpful to choose
Answer & Explanation
cheekabooy
Skilled2021-02-01Added 83 answers
Step 1
Following the suggestions given by the problem, let
enter the population numbers with 94000 subtracted from each.
Using Desmos, first add a table. (clic on "
Step 2
Step 3
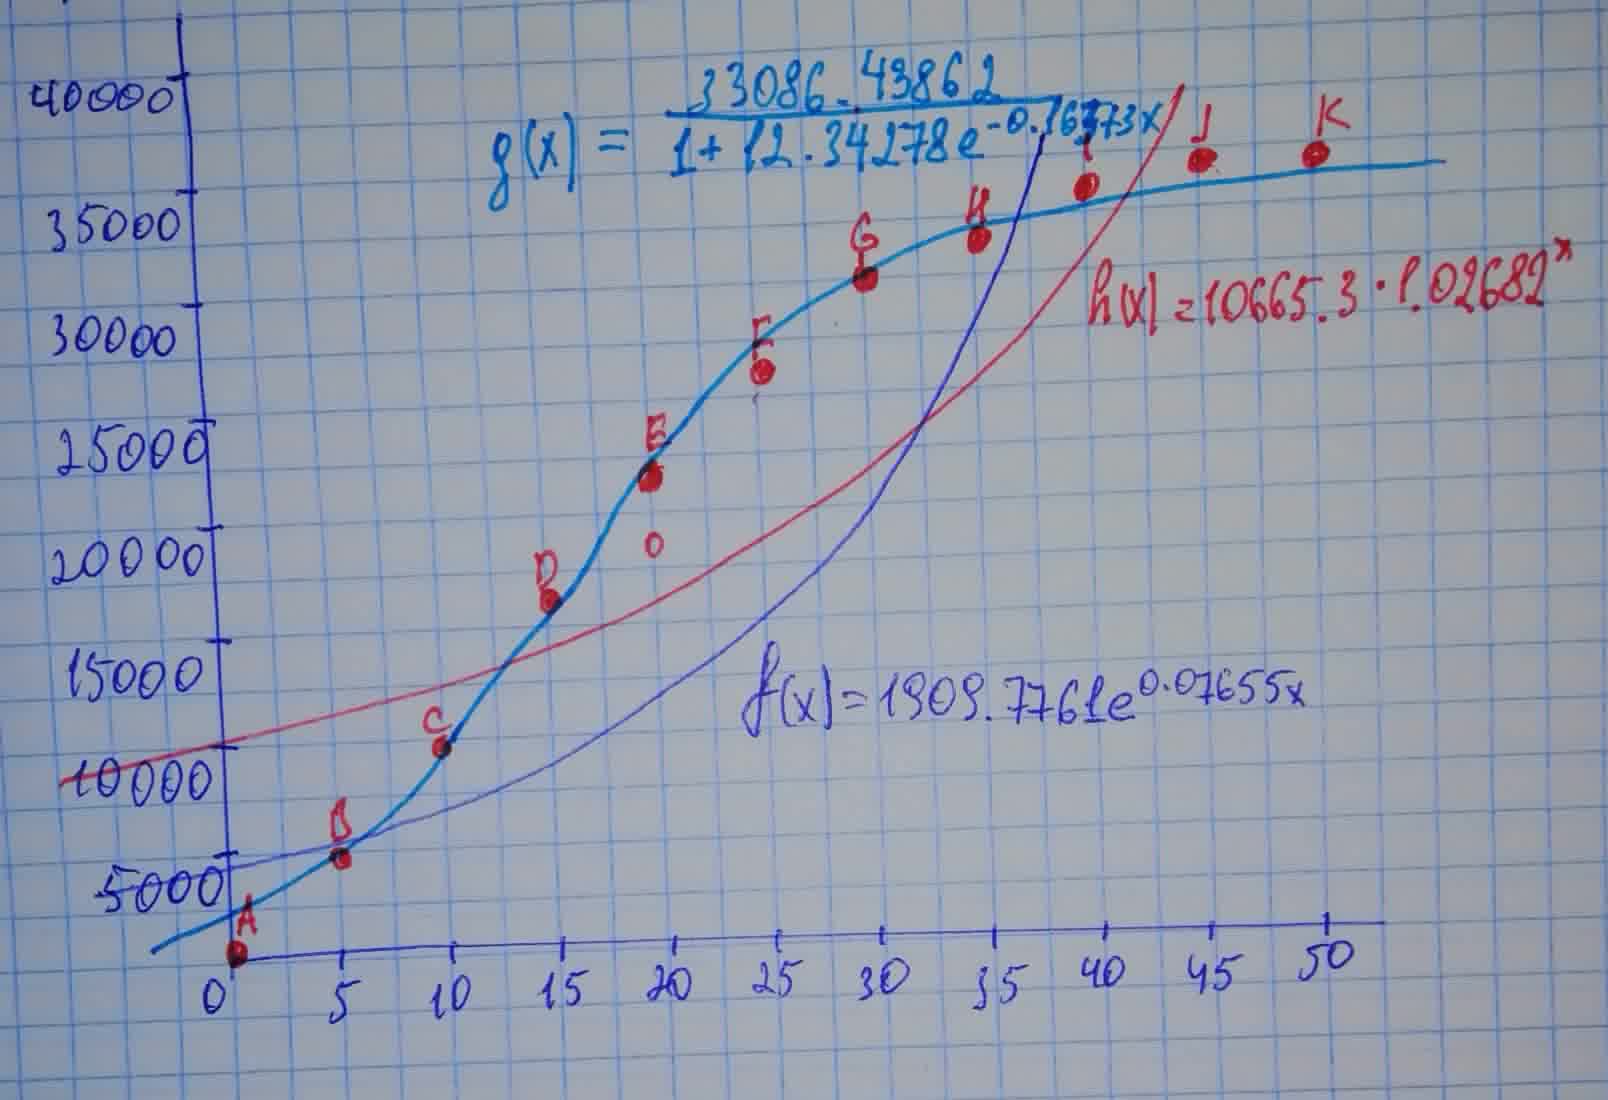
Next, you can get an exponential form
The values for a and b appear below. It should look similar to what is the lower right in the image above. Desmos gives a different answer than the book's. (Compare it in the graph at the bottom). The model with the proper variable names and shifted back up by 94000 would be:
Step 4
Next in another box below, type this to get a logistic model:
Step 5
This time it does given an answer similar to the book's. Using the right variables and shifting back up by 94000, we have:
Step 6
Using GeoGebra 5 and entering the same numbers in as a list of points, the command FitExp does give the same answer as the book. (shifted it back up by 94000 here)
Step 7
The logistic model is better than the exponential. The Desmos one seems to stay closer to the points overall than the other exponential one.
New Questions in Algebra II
Which operation could we perform in order to find the number of milliseconds in a year??
Tell about the meaning of Sxx and Sxy in simple linear regression,, especially the meaning of those formulas
Is the number 7356 divisible by 12? Also find the remainder.
A) No
B) 0
C) Yes
D) 6What is a positive integer?
Determine the value of k if the remainder is 3 given
Is a prime number?
What is the square root of ?
Is the sum of two prime numbers is always even?
149600000000 is equal to
A)
B)
C)
D)Find the value of to the base ?
What is the square root of 3 divided by 2 .
write as an equivalent expression using a fractional exponent.
simplify
What is the square root of