The following table shows the approximate average household income in the United States in 1990, 1995, and 2003.
mattgondek4
Answered question
2020-12-24
The following table shows the approximate average household income in the United States in 1990, 1995, and 2003. (
Which of the following kinds of models would best fit the given data?
Explain your choice of model. ( a, b, c, and m are constants.)
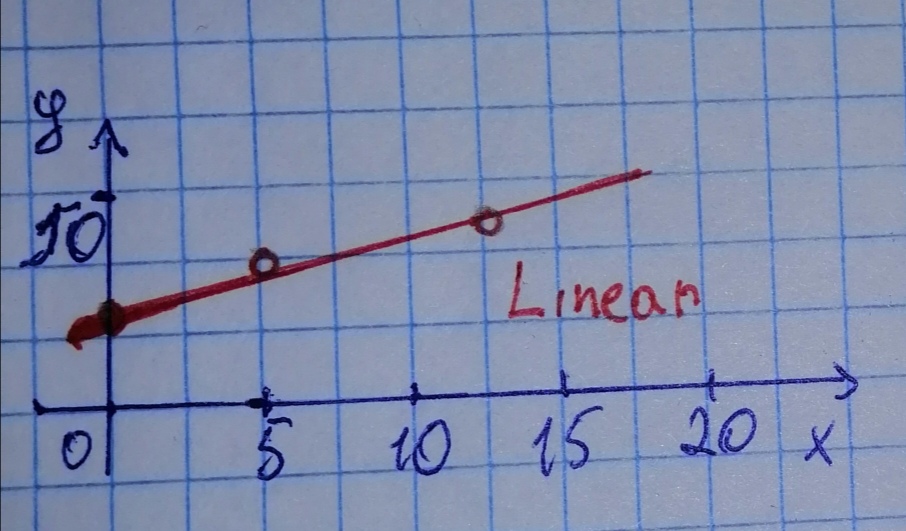
a) Linear:
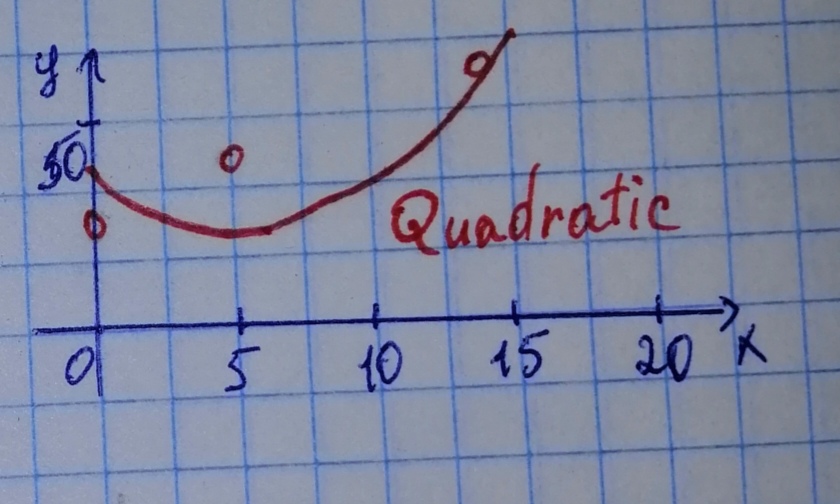
b) Quadratic:
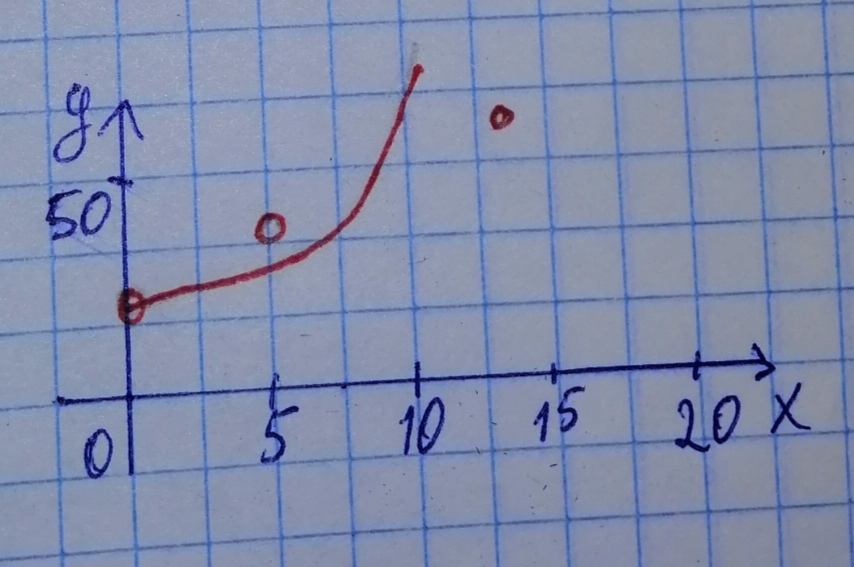
c) Exponential:
Answer & Explanation
Talisha
Skilled2020-12-25Added 93 answers
Step 1
Plot the points on acoordinate system.
Scetching the various models and their characteristics (see below), we find that the linear model would be best for this data set.
Step 2
not exponential, because the rate of rising does not seem to change.
Not quadratic, because there are no "dips" or "bulges" to account for minimum/maximum values.
New Questions in Algebra II
Which operation could we perform in order to find the number of milliseconds in a year??
Tell about the meaning of Sxx and Sxy in simple linear regression,, especially the meaning of those formulas
Is the number 7356 divisible by 12? Also find the remainder.
A) No
B) 0
C) Yes
D) 6What is a positive integer?
Determine the value of k if the remainder is 3 given
Is a prime number?
What is the square root of ?
Is the sum of two prime numbers is always even?
149600000000 is equal to
A)
B)
C)
D)Find the value of to the base ?
What is the square root of 3 divided by 2 .
write as an equivalent expression using a fractional exponent.
simplify
What is the square root of