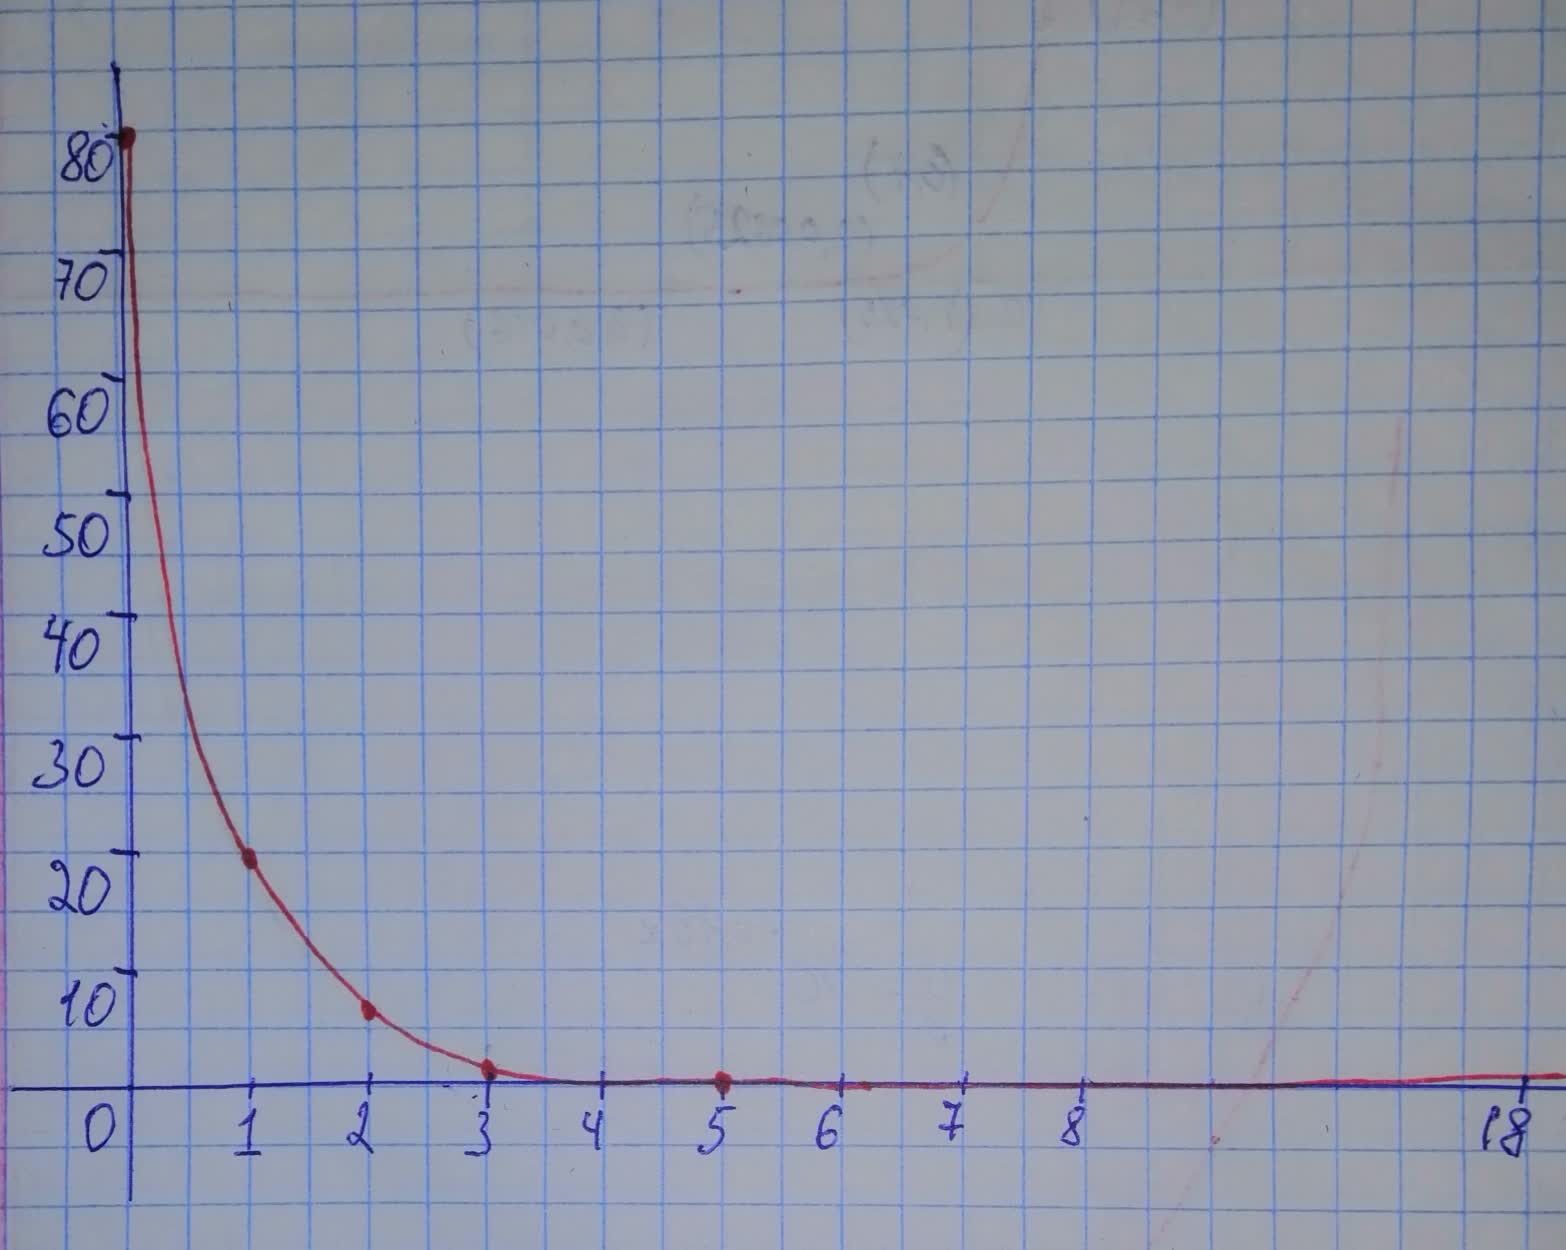
Graph each function and tell whether it represents exponential growth, exponential decay, or neither. y=80(0.25)^{x}
ankarskogC
Answered question
2021-01-05
Answer & Explanation
delilnaT
Skilled2021-01-06Added 94 answers
Graph of the function:
Step 2
The function represents exponential decay because as value of x intereases, the value of y decreases. Each term has a common ratio of 0.25.
Jeffrey Jordon
Expert2021-10-27Added 2605 answers
Answer is given below (on video)
New Questions in Algebra II
Which operation could we perform in order to find the number of milliseconds in a year??
Tell about the meaning of Sxx and Sxy in simple linear regression,, especially the meaning of those formulas
Is the number 7356 divisible by 12? Also find the remainder.
A) No
B) 0
C) Yes
D) 6What is a positive integer?
Determine the value of k if the remainder is 3 given
Is a prime number?
What is the square root of ?
Is the sum of two prime numbers is always even?
149600000000 is equal to
A)
B)
C)
D)Find the value of to the base ?
What is the square root of 3 divided by 2 .
write as an equivalent expression using a fractional exponent.
simplify
What is the square root of