The table gives the number of active Twitter users worldwide, semiannually from 2010 to 2016.
glamrockqueen7
Answered question
2021-02-09
The table gives the number of active Twitter users worldwide, semiannually from 2010 to 2016.
Use a calculator or computer to fit both an exponential function and a logistic function to these data. Graph the data points and both functions, and comment on the accuracy of the models.
Answer & Explanation
Velsenw
Skilled2021-02-10Added 91 answers
Step 1 Using Desmos, first add a table. (click on "+" at the upper left) and add the numbers. It should look something like in this image:
Step 2 Next, you can get the exponential model form
Step 3 You can get the logistic model form
Step 4 The logistic model is more accurate because it has larger 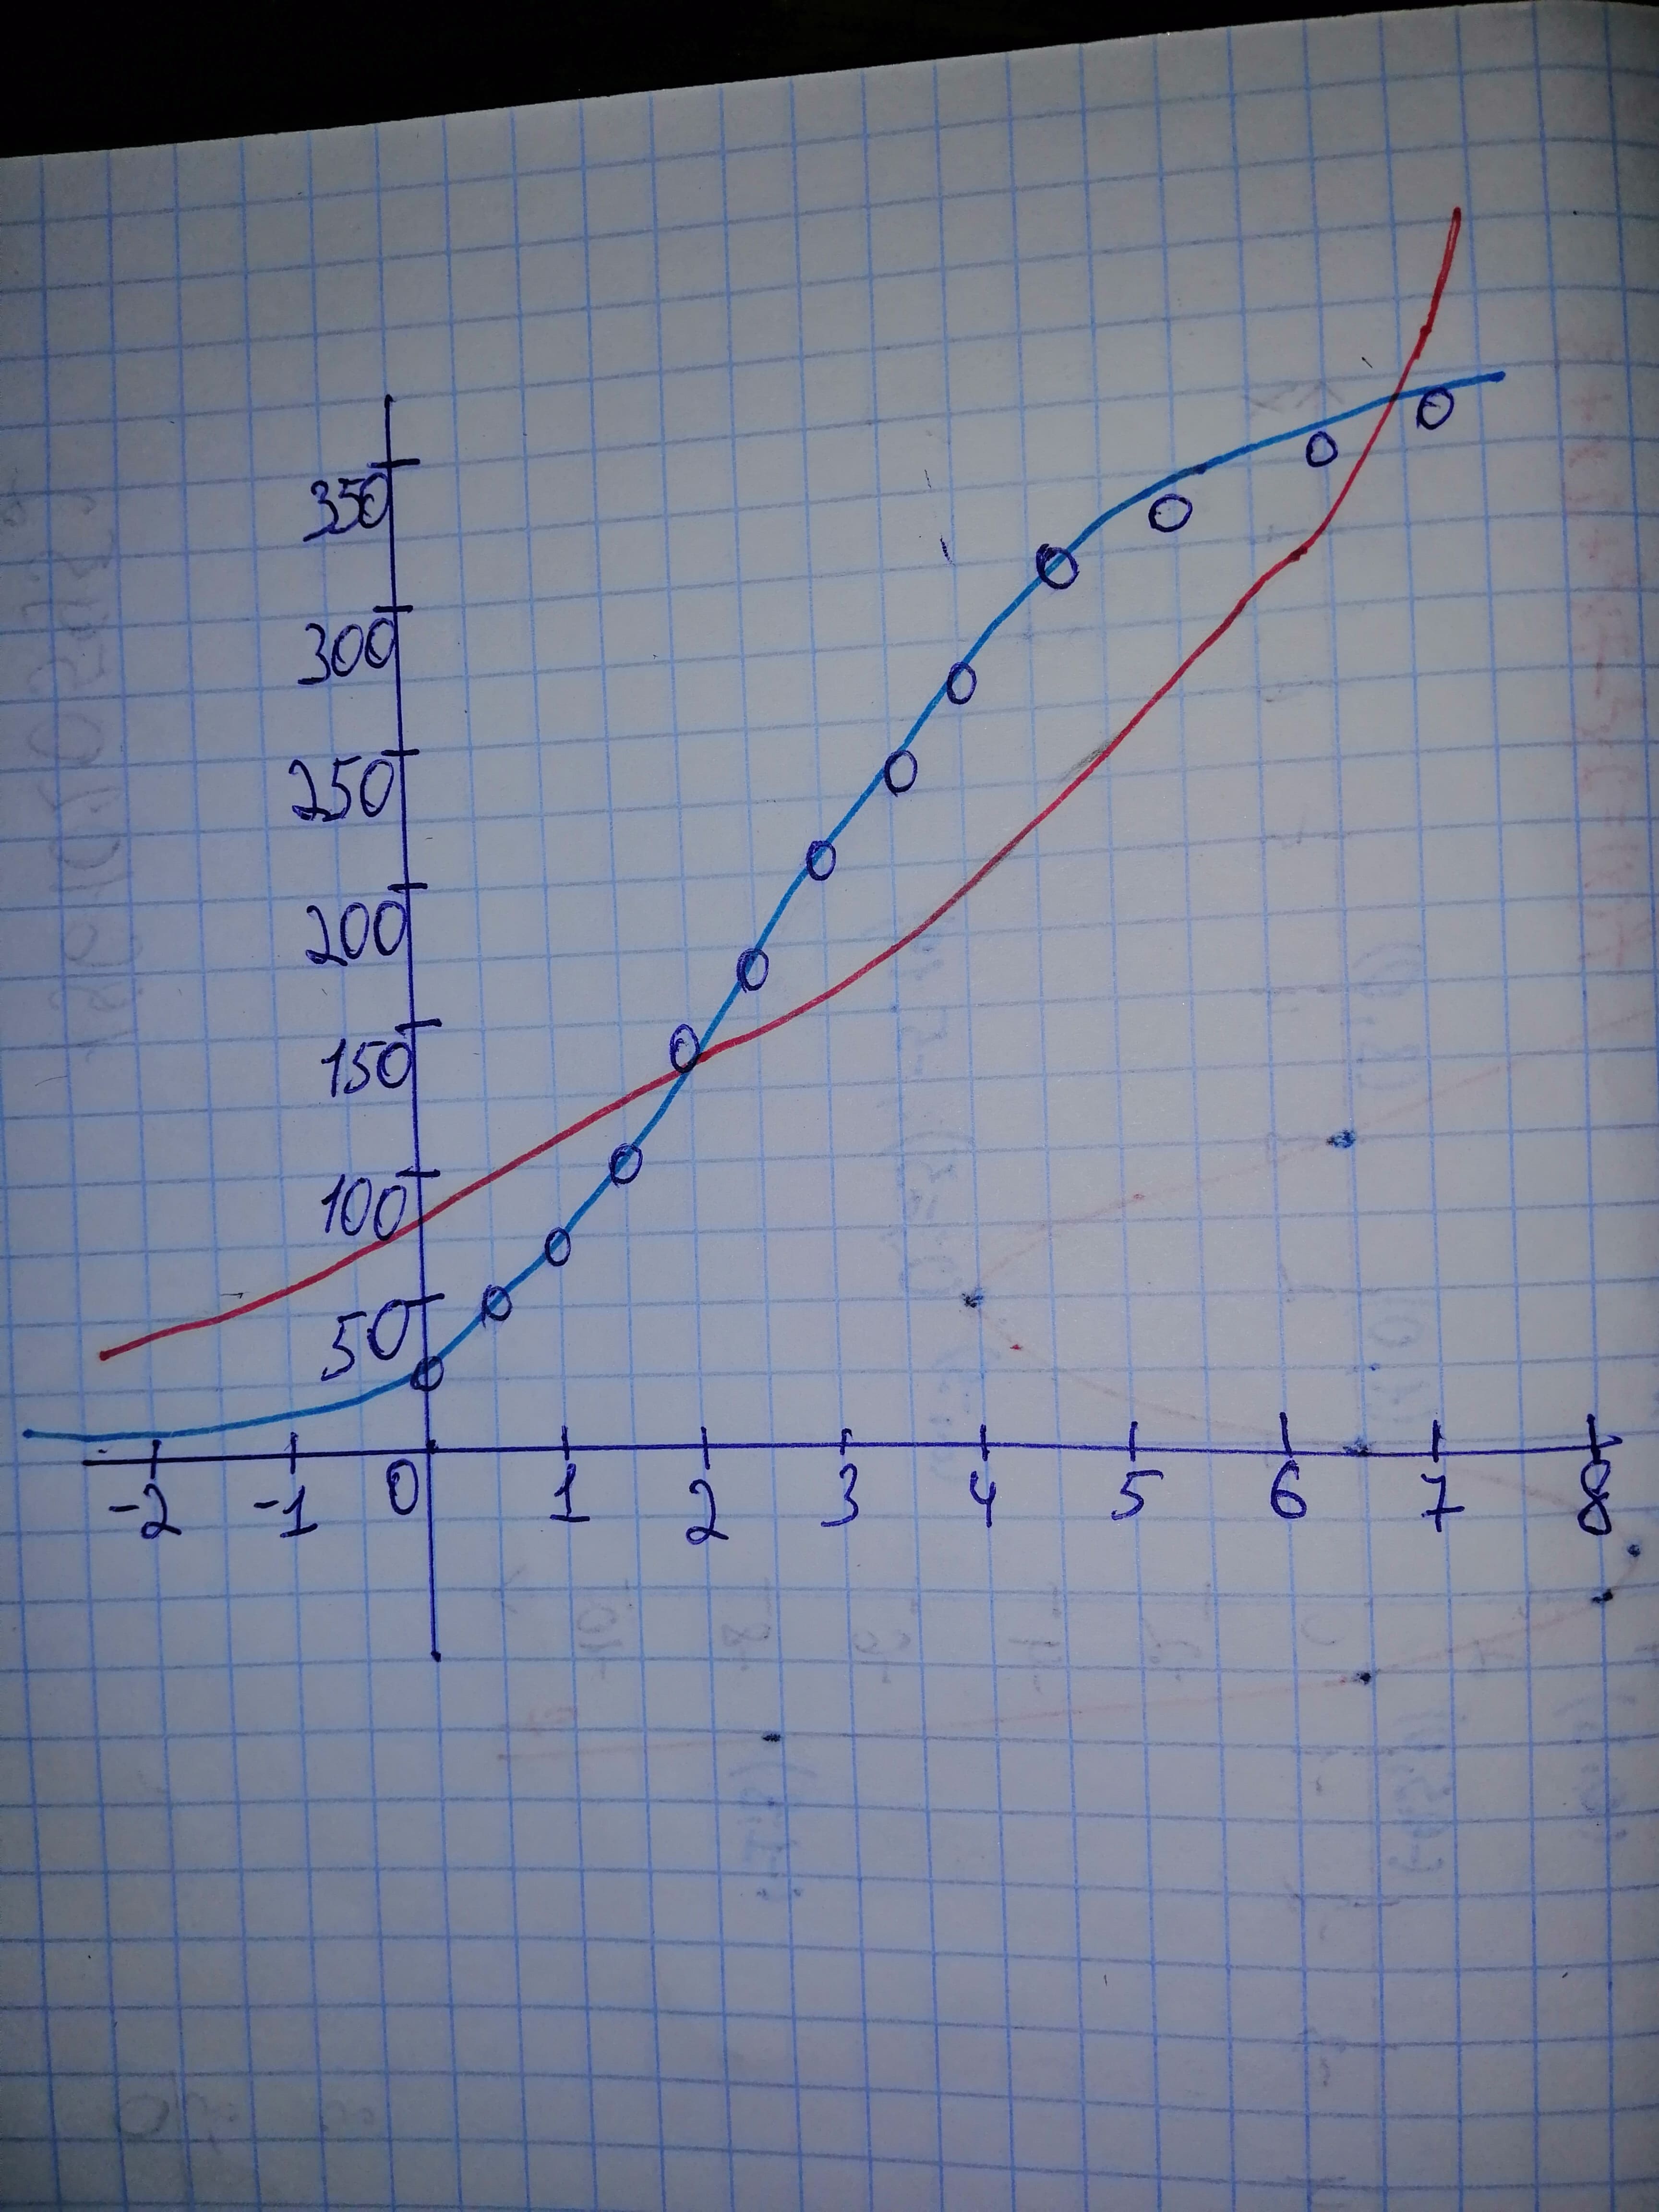
New Questions in Algebra II
Which operation could we perform in order to find the number of milliseconds in a year??
Tell about the meaning of Sxx and Sxy in simple linear regression,, especially the meaning of those formulas
Is the number 7356 divisible by 12? Also find the remainder.
A) No
B) 0
C) Yes
D) 6What is a positive integer?
Determine the value of k if the remainder is 3 given
Is a prime number?
What is the square root of ?
Is the sum of two prime numbers is always even?
149600000000 is equal to
A)
B)
C)
D)Find the value of to the base ?
What is the square root of 3 divided by 2 .
write as an equivalent expression using a fractional exponent.
simplify
What is the square root of