Researchers have asked whether there is a relationship between nutrition and cancer, and many studies have shown that there is. In fact, one of the co
Dillard
Answered question
2021-02-25
Answer & Explanation
Szeteib
Skilled2021-02-26Added 102 answers
Given: 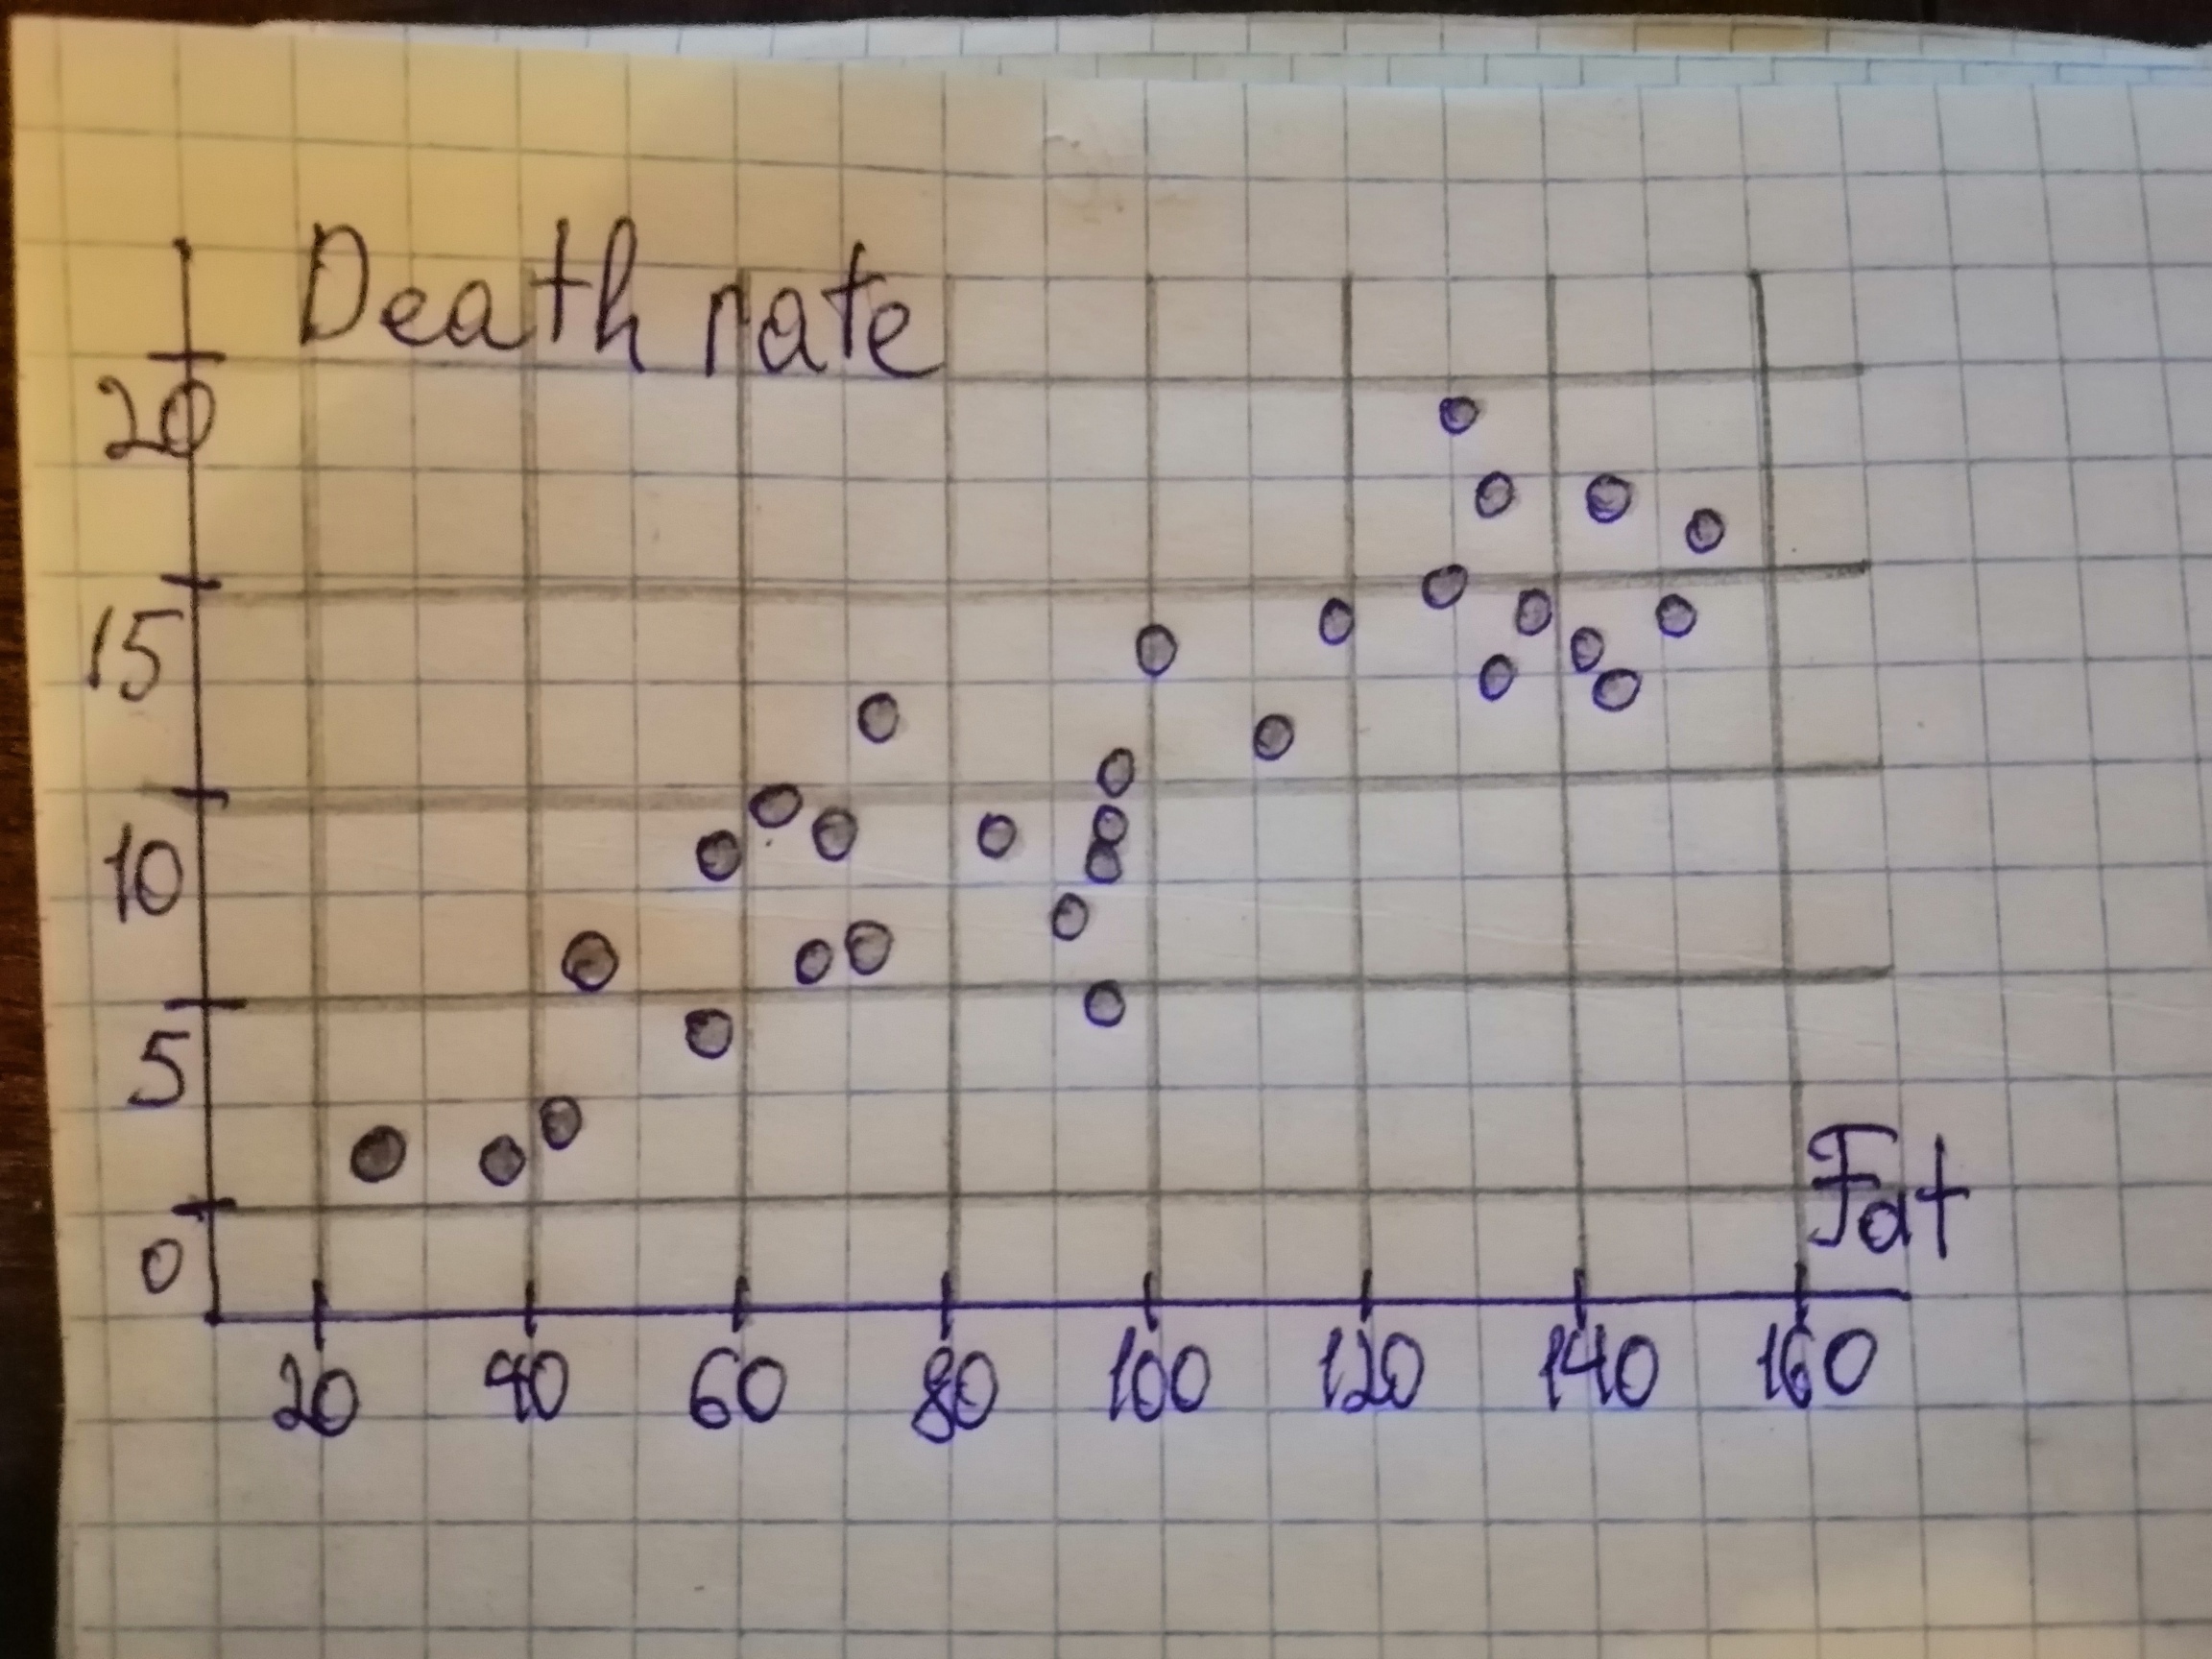 b) When there is no strong curvature presents in the scatterplot, then it is safe to assume that there is a linear relationship between the variables and thus it is then reasonable to find a regression line. We note that the scatterplot of part (a) does not contain strong curvature and thus it is reasonable to find the regression line. c) We determine all necessary sums:
New Questions in College Statistics
The product of the ages, in years, of three (3) teenagers os 4590. None of the have the sane age. What are the ages of the teenagers???
Use the row of numbers shown below to generate 12 random numbers between 01 and 99
78038 18022 84755 23146 12720 70910 49732 79606
Starting at the beginning of the row, what are the first 12 numbers between 01 and 99 in the sample?How many different 10 letter words (real or imaginary) can be formed from the following letters
H,T,G,B,X,X,T,L,N,J.Is every straight line the graph of a function?
For the 1s orbital of the Hydrogen atom, the radial wave function is given as: (Where ∘A)
The ratio of radial probability density of finding an electron at to the radial probability density of finding an electron at the nucleus is given as (). Calculate the value of (x+y).Find the sets and if and . Are they unique?
What are the characteristics of a good hypothesis?
If x is 60% of y, find .
A)
B)
C)
D)The numbers of significant figures in are:
A)Two
B)Three
C)Ten
D)Thirty oneWhat is positive acceleration?
Is power scalar or vector?
What is the five-step process for hypothesis testing?
How to calculate Type 1 error and Type 2 error probabilities?
How long will it take to drive 450 km if you are driving at a speed of 50 km per hour?
1) 9 Hours
2) 3.5 Hours
3) 6 Hours
4) 12.5 HoursWhat is the square root of 106?