Sketch a scatterplot in which the presence of an outlier decreases the observed correlation between the response and explanatory variables. Indicate on your plot which point is the outlier.
he298c
Answered question
2020-11-05
Answer & Explanation
Malena
Skilled2020-11-06Added 83 answers
Step 1
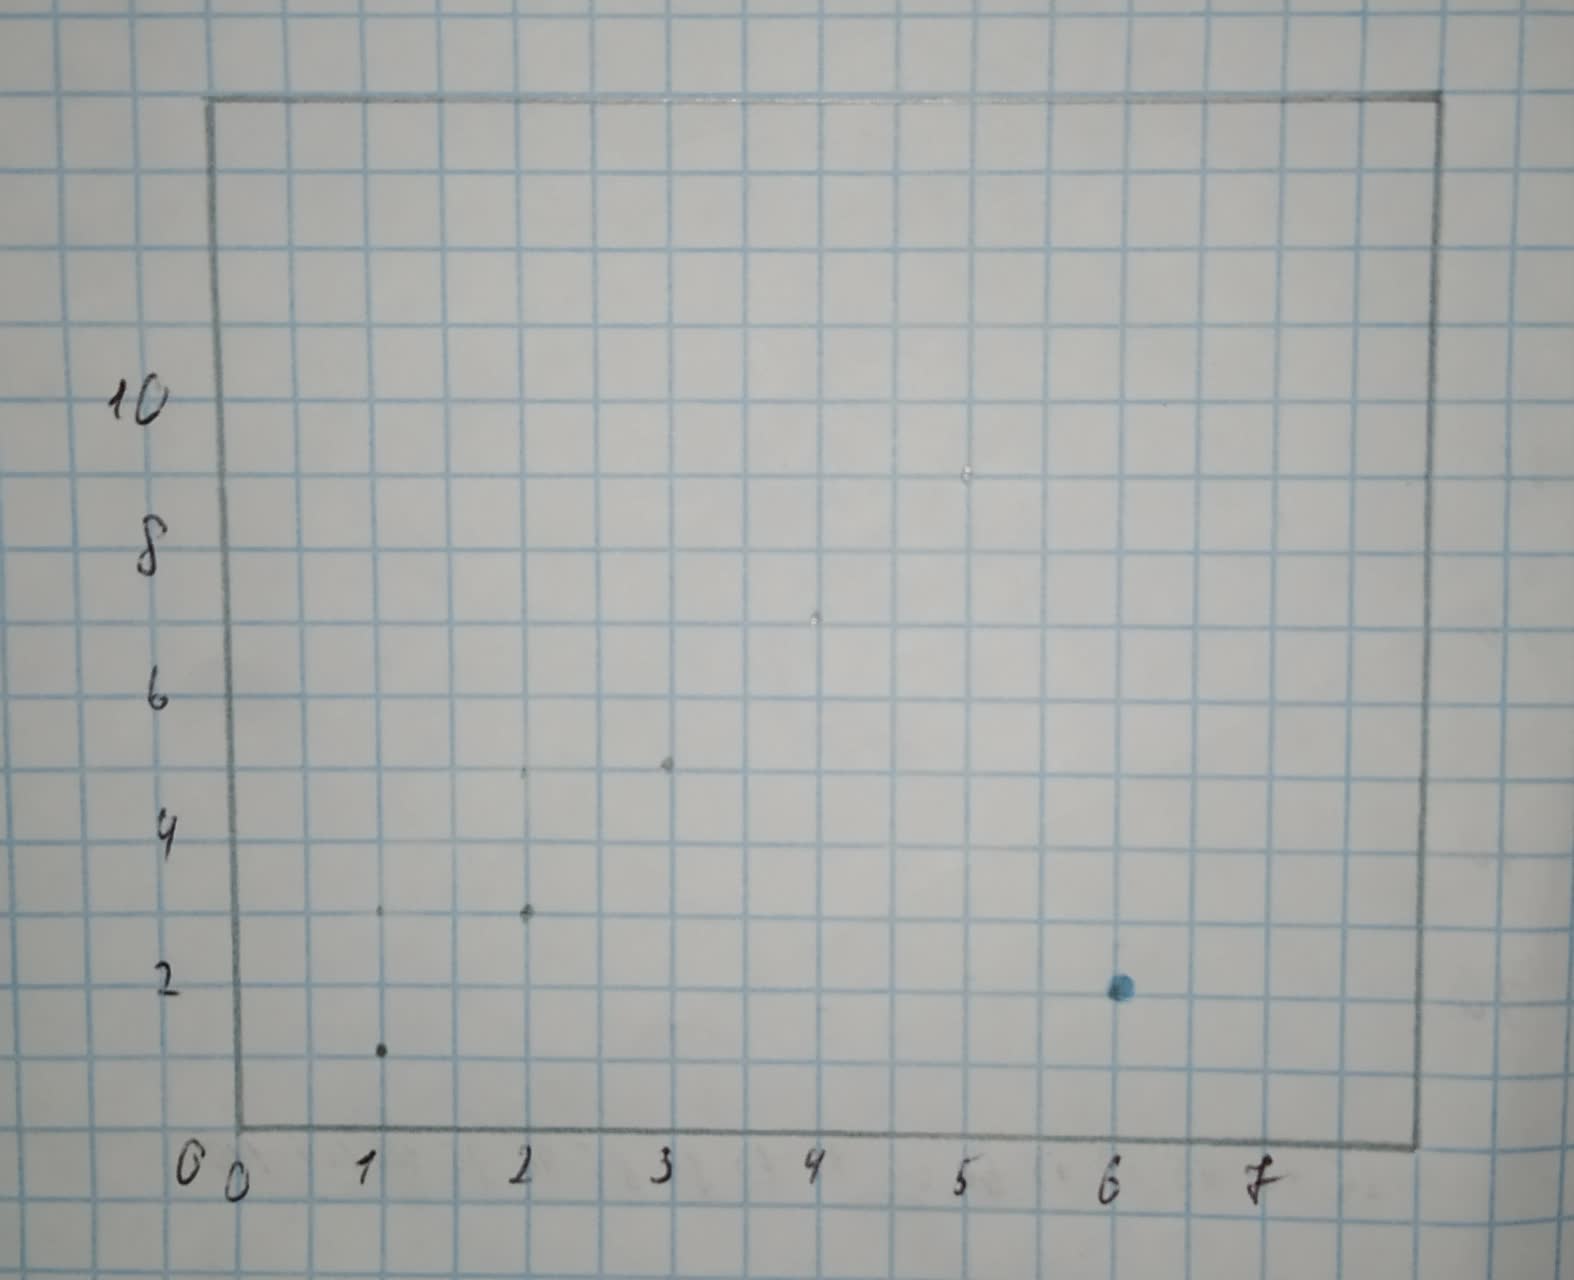
Let the following data be the initial dataset (without any outliers):
[x 1 2 3 4 5 y 1 3 5 7 9]
Since all points lie on the line
Let's add the point (6,2) to our initial dataset, so that the data is:
[x 1 2 3 4 5 6 y 1 3 5 7 9 2]
The outlier that we've just added clearly doesn’t belong to the line
since
Therefore, we lost the perfect relationship between the two variables, so the correlation coefficient decreased and the new correlation coefficient is
Here is the scatterplot of the given data (outlier is coloured in blue):
New Questions in High school statistics
Read carefully and choose only one option
A statistic is an unbiased estimator of a parameter when (a) the statistic is calculated from a random sample. (b) in a single sample, the value of the statistic is equal to the value of the parameter. (c) in many samples, the values of the statistic are very close to the value of the parameter. (d) in many samples, the values of the statistic are centered at the value of the parameter. (e) in many samples, the distribution of the statistic has a shape that is approximately NormalConstruct all random samples consisting three observations from the given data. Arrange the observations in ascending order without replacement and repetition.
86 89 92 95 98.Find the mean of the following data: 12,10,15,10,16,12,10,15,15,13.
The equation has a positive slope and a negativey-intercept.
1) y=−2x−3
2) y=2−3x
3) y=2+3x
4) y=−2+3xWhat term refers to the standard deviation of the sampling distribution?
Fill in the blanks to make the statement true: .
What percent of is
The first 15 digits of pi are as follows: 3.14159265358979
The frequency distribution table for the digits is as follows:
Which two digits appear for 3 times each?
A) 1, 7
B) 2, 6
C) 5, 9<br<D) 3, 8How to write
What is the simple interest of a loan for $1000 with 5 percent interest after 3 years?
What number is 12% of 45?
The probability that an automobile being filled with gasoline also needs an oil change is 0.30; the probability that it needs a new oil filter is 0.40; and the probability that both the oil and the filter need changing is 0.10. (a) If the oil has to be changed, what is the probability that a new oil filter is needed? (b) If a new oil filter is needed, what is the probability that the oil has to be changed?
Leasing a car. The price of the car is$45,000. You have $3000 for a down payment. The term of the lease is and the interest rate is 3.5% APR. The buyout on the lease is51% of its purchase price and it is due at the end of the term. What are the monthly lease payments (before tax)?
The mean of sample A is significantly different than the mean of sample B. Sample A: Sample B: Use a two-tailed -test of independent samples for the above hypothesis and data. What is the -value?
What is mean and its advantages?