The article “Statistical Modeling of the Time Course of Tantrum Anger” (Annals o
jack89515lg
Answered question
2021-11-18
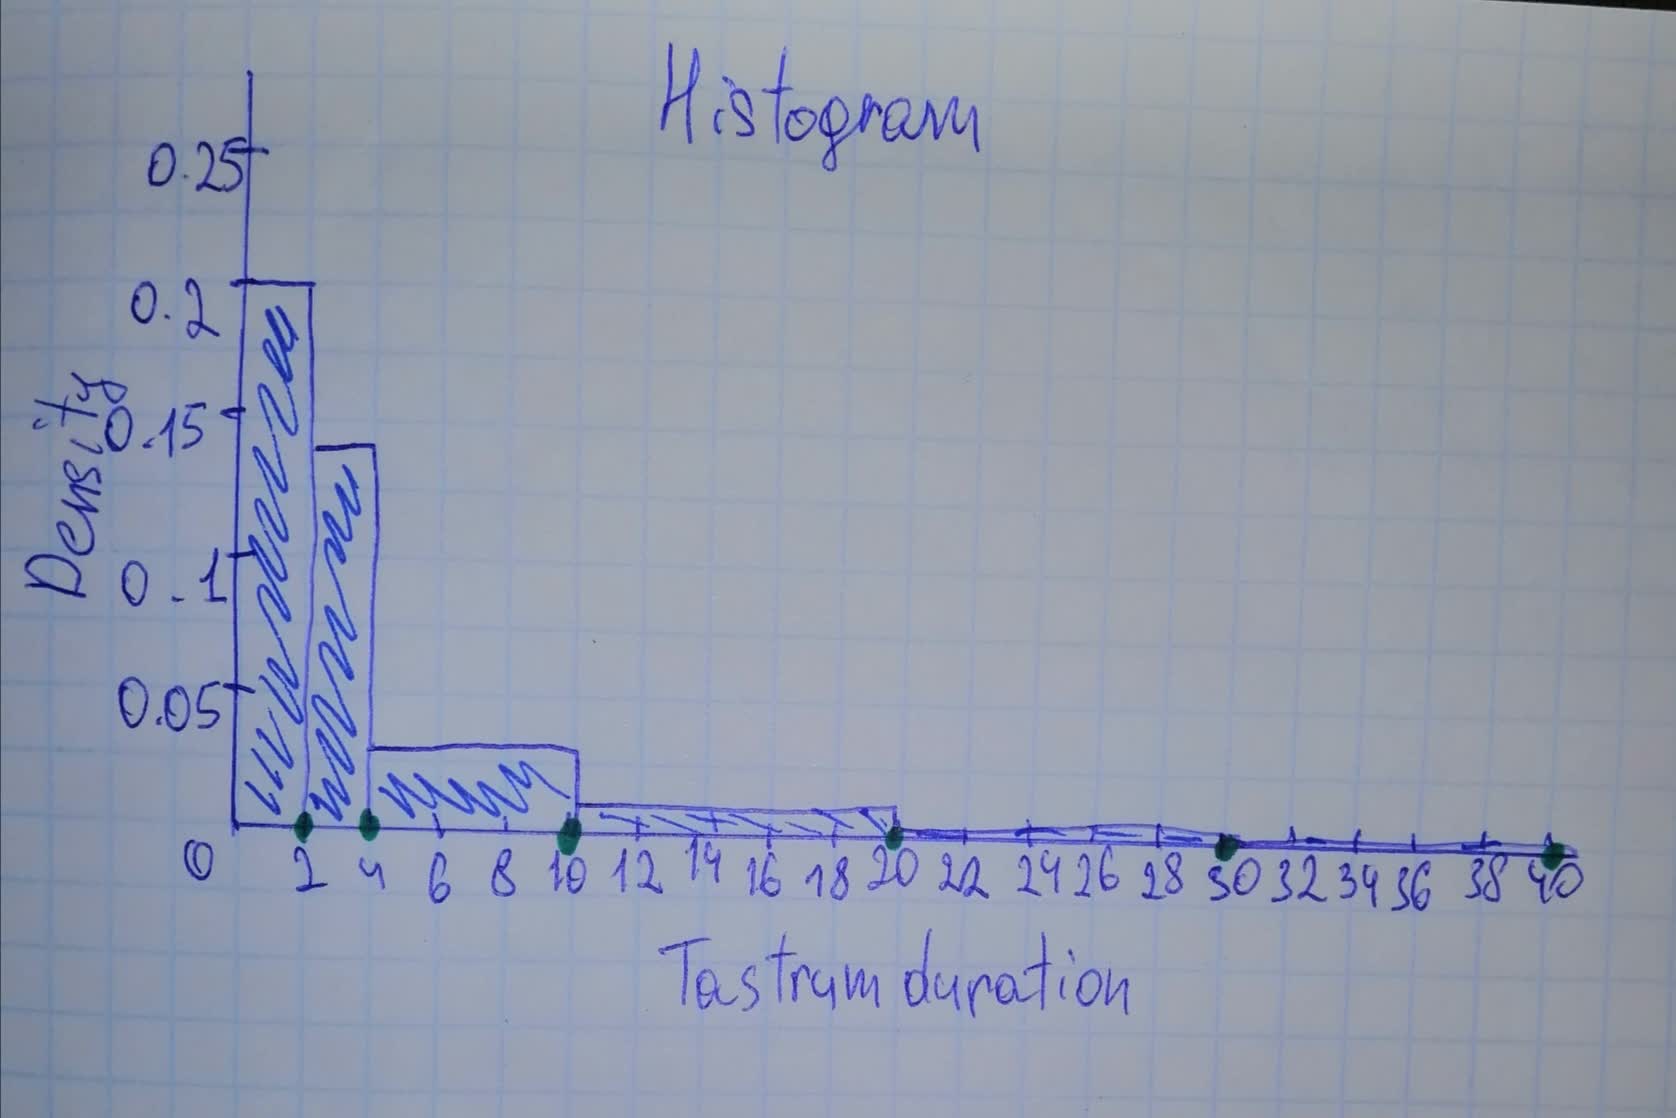
The article “Statistical Modeling of the Time Course of Tantrum Anger” (Annals of Applied Stats, 2009: 1013–1034) discussed how anger intensity in children’s tantrums could be related to tantrum duration as well as behavioral indicators such as shouting, stamping, and pushing or pulling. The following frequency distribution was given (and also the cor responding histogram):
Draw the histogram and then comment on any interesting features.
Answer & Explanation
Harr1957
Beginner2021-11-19Added 18 answers
Step 1
As we can see, the class intervals have unequal lenght, which means that we need to use hisrogram with unequal ckass widths.
Constructing a Histogram for continuous data: Unequal Class Widths:
After determining frequencies and relative frequencies, calculate teh height of each rectangle using the formula
The resulting rectangle height are usually called densities, and the vertical scale is the density scale. This prescription will also work when class widths are equal.
Step 2
Look at the following table:
In the table, intervals and frequencies were given in the exercise.
Class width is difference between upper bound and lower bound.
Relative Frequency is Frequency dividedd by total (sum) of all frequencies which is
We get the density column by dividing the Relative Frequency with the Class Width
Now we have everything we need to create a histogram.
Step 3
Step 4
The histogram is positively skewed (more data points on the left side). It is not clear from the histogram to see which value would be representiative (typical) value. The histogram is unimodal (it has only one peak-hump). We can notice that the most tantrums are between 0 and 11 (around
There are only small amount of tantrums that last more than 30 minutes (we can not even see them clearly on the histogram).
Mespirst
Beginner2021-11-20Added 17 answers
New Questions in Other
22+64
When a cold drink is taken from a refrigerator, its temperature is 5 degree C. After 25 minutes in a 20 degree C room its temperature has increased to 10 degree C. What is the temperature of the drink after 50 minutes?
How many minutes are there in hours?
Find the answer for power .
The following law describes the relationship between gas volume and pressure: ________. A)Boyle's law; B)Henry's law; C)Charles' law; D)Dalton's law
If an electric switch is open then no current flows through the circuit.
A)True;
B)FalseThe price elasticity of supply of a good is 0.8. Its price rises by 50 per cent. Calculate the percentage increase in its supply.
How many quarts are in 10 gallons?
When the net force acting on an object is zero, the total momentum of the system will:
A)remain constant;
B)increase with time;
C)decrease with time;
D)None of theseHow many centimeters are in four meters?
A notebook computer has a mass of 2.25 kilograms. About how many pounds does the notebook weigh?
If the dot product of two non-zero vectors is zero, then the vectors A)are parallel to each other. B)are perpendicular to each other. C)can have any orientation. D)are anti-parallel to each other.
Which is longer 5 miles or 10 kilometers?
9 grams is how many milligrams?
How to write in scientific notation?