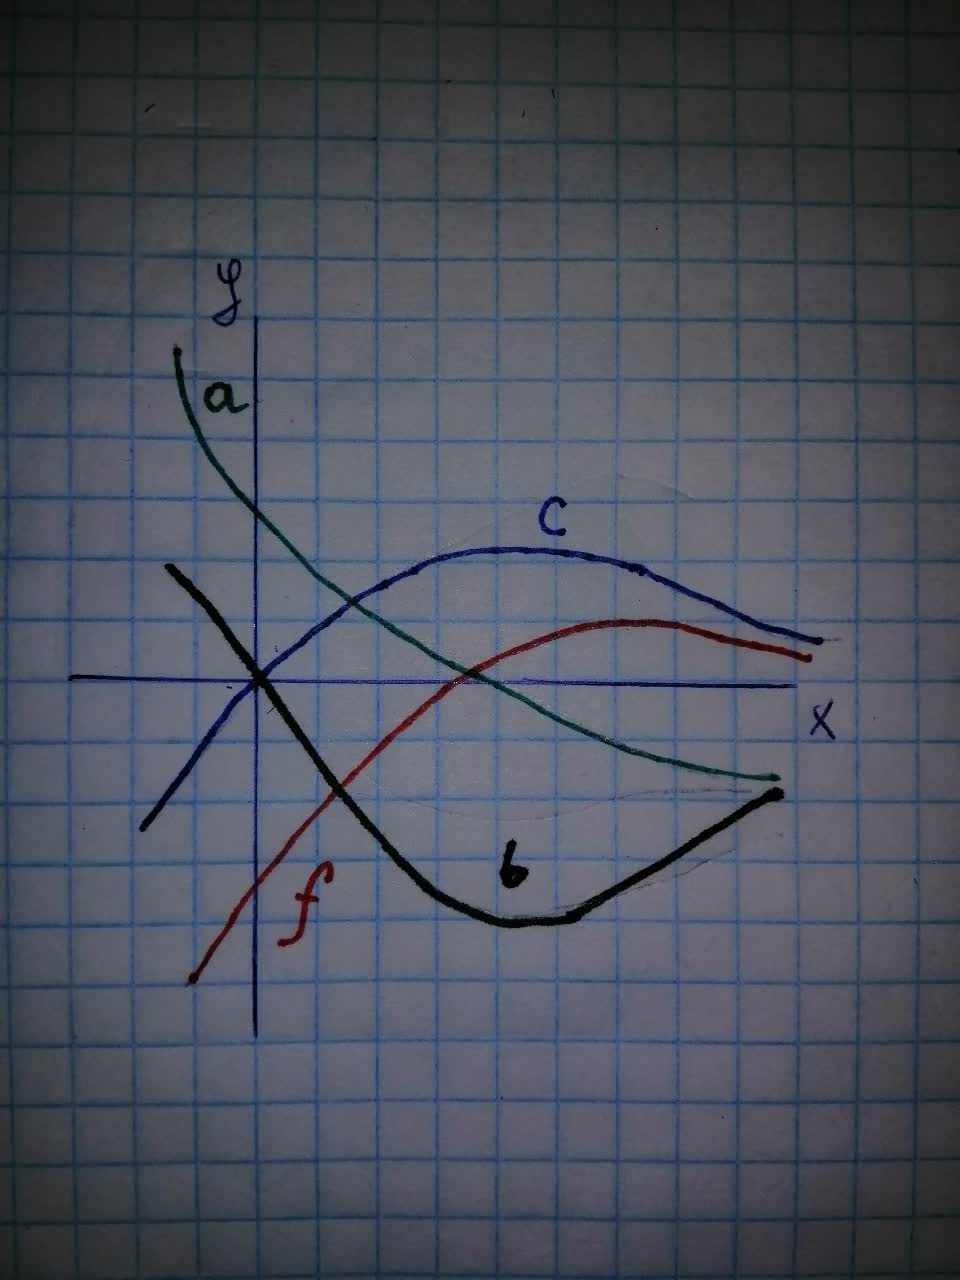
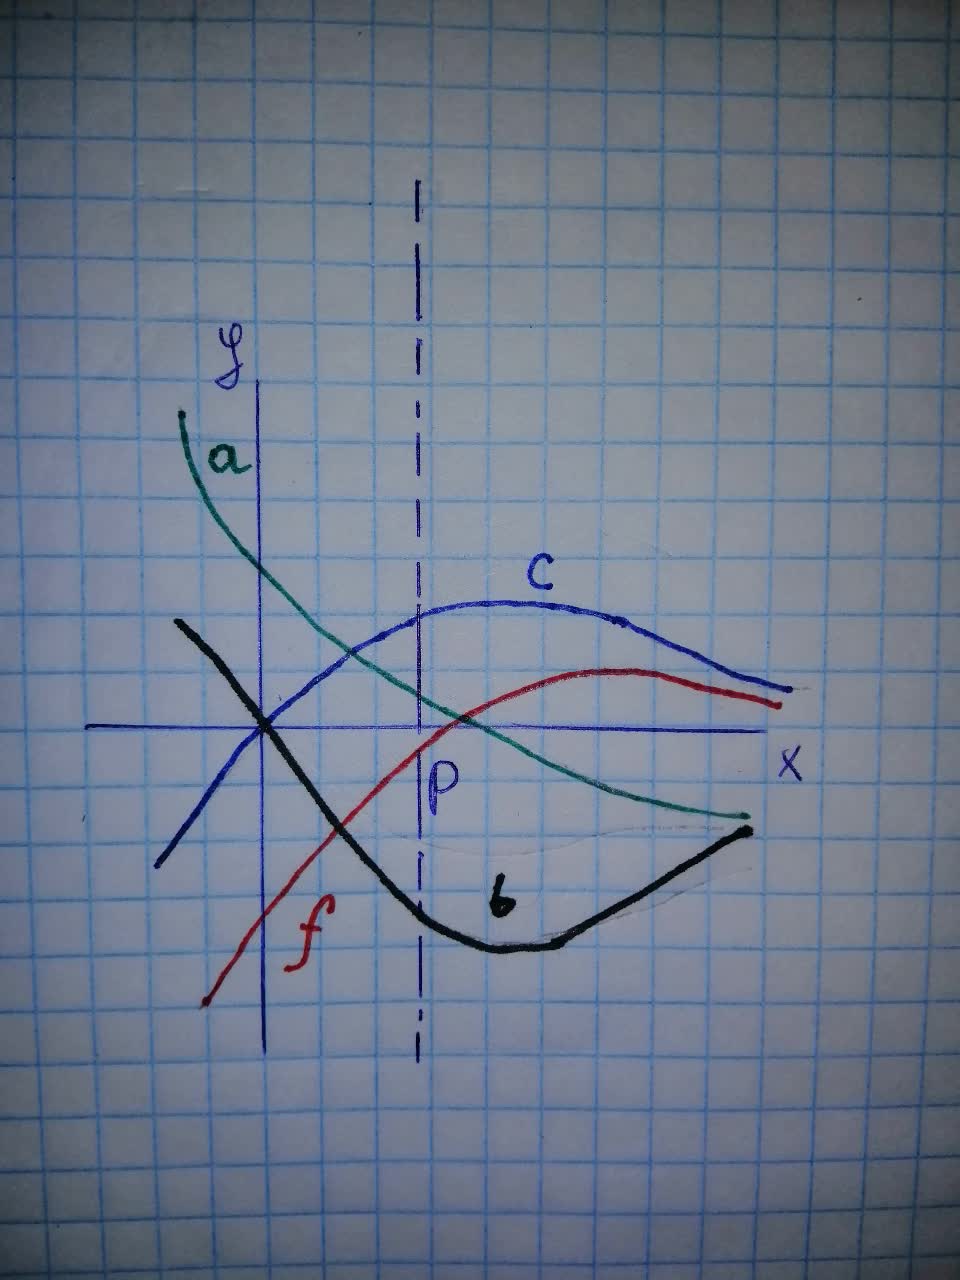
The graph of a function f is shown. Which graph is an antiderivative of f? F
philosphy111of
Answered question
2021-11-18
Answer & Explanation
Coldst
Beginner2021-11-19Added 18 answers
Let
Now, since
Again we notice that
So, the correct graph for the antiderivative of
New Questions in Algebra I
Find the volume V of the described solid S
A cap of a sphere with radius r and height h.
V=??
Whether each of these functions is a bijection from R to R.
a)
b)
c)
?In how many different orders can five runners finish a race if no ties are allowed???
State which of the following are linear functions?
a.
b.
c.
d.Three ounces of cinnamon costs $2.40. If there are 16 ounces in 1 pound, how much does cinnamon cost per pound?
A square is also a
A)Rhombus;
B)Parallelogram;
C)Kite;
D)none of theseWhat is the order of the numbers from least to greatest.
,
,
,
Write the numerical value of
Solve for y. 2y - 3 = 9
A)5;
B)4;
C)6;
D)3How to graph ?
How to graph using a table?
simplify
How to find the vertex of the parabola by completing the square ?
There are 60 minutes in an hour. How many minutes are there in a day (24 hours)?
Write 18 thousand in scientific notation.