The following table lists the annual amounts of glass cullet produced by Kimble Glass Works, Inc. Year Code Scrap (tons) 1999 1 2.0 2000 2 4.0 2001 3 3.0 2002 4 5.0 2003 5 6.0 Determine the least squares trend equation. Estimate the amount of scrap for the year 2005.
arenceabigns
Answered question
2021-04-25
The following table lists the annual amounts of glass cullet produced by Kimble Glass Works, Inc.
Determine the least squares trend equation. Estimate the amount of scrap for the year 2005.
Answer & Explanation
Nathaniel Kramer
Skilled2021-04-27Added 78 answers
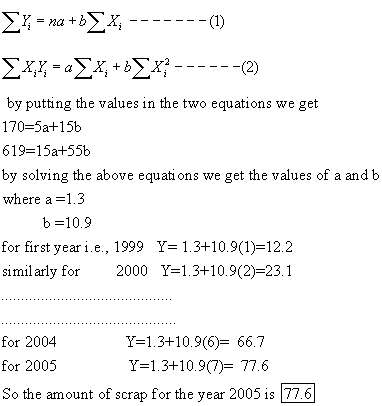
First we have to draw a graph by then we can observethat this graph shows a straight line. So we have tofit a strainght line
Y= a+bX
where y is the scrap in tons and X is the years, take years as 1, 2, 3, 4, and 5 then
total
we know that the normal equations for straight line are
New Questions in Other
22+64
When a cold drink is taken from a refrigerator, its temperature is 5 degree C. After 25 minutes in a 20 degree C room its temperature has increased to 10 degree C. What is the temperature of the drink after 50 minutes?
How many minutes are there in hours?
Find the answer for power .
The following law describes the relationship between gas volume and pressure: ________. A)Boyle's law; B)Henry's law; C)Charles' law; D)Dalton's law
If an electric switch is open then no current flows through the circuit.
A)True;
B)FalseThe price elasticity of supply of a good is 0.8. Its price rises by 50 per cent. Calculate the percentage increase in its supply.
How many quarts are in 10 gallons?
When the net force acting on an object is zero, the total momentum of the system will:
A)remain constant;
B)increase with time;
C)decrease with time;
D)None of theseHow many centimeters are in four meters?
A notebook computer has a mass of 2.25 kilograms. About how many pounds does the notebook weigh?
If the dot product of two non-zero vectors is zero, then the vectors A)are parallel to each other. B)are perpendicular to each other. C)can have any orientation. D)are anti-parallel to each other.
Which is longer 5 miles or 10 kilometers?
9 grams is how many milligrams?
How to write in scientific notation?