A hybrid course is one that contains both online and classroom instruction. In a study performed at Middle Georgia State University, a software packag
vestirme4
Answered question
2020-11-08
a. Construct a 95% confidence interval for the mean number of hours it takes for a student to meet the course objectives.
Answer & Explanation
Layton
Skilled2020-11-09Added 89 answers
A.95% confidence interval for the mean number of hours it takes for the student to makes course of objectives is, First, compute f-critical value then find confidence interval.
The t critical value for the 95% confidence interval is,
The sample size is small and two-tailed test. Look in the column headed and the row headed in the fdistribution table by using degree of freedom is,
d.f.=n-1
=45-1=44
The tcritical value for the 95% confidence interval is 2.015.
Step 2
= 65.12 to 95.88
65.12 to 95.884 95% confidence interval for the mean number of hours it takes for the student to makes course of objectives is.
Step 3
Since you have posted a question with multiple sub-parts, we will solve first sub-parts for you. To get remaining sub-part solved please repost the complete question and mention the sub-parts to be solved.
New Questions in College algebra
Given that 1 and l , evaluate each of the following. Hint: use the properties of logarithms to rewrite the given logarithm in terms of the the logarithms of 3 and 5.
The equation above shows how temperature F, measured in degrees Fahrenheit, relates to a temperature C, measured in degrees Celsius. Based on the equation, which of the following must be true?
1. A temperature increase of 1 degree Fahrenheit is equivalent to a temperature increase of degree Celsius.
2. A temperature increase of 1 degree Celsius is equivalent to a temperature increase of 1.8 degrees Fahrenheit.
3. A temperature increase of degree Fahrenheit is equivalent to a temperature increase of 1 degree Celsius.
A) I only
B) II only
C) III only
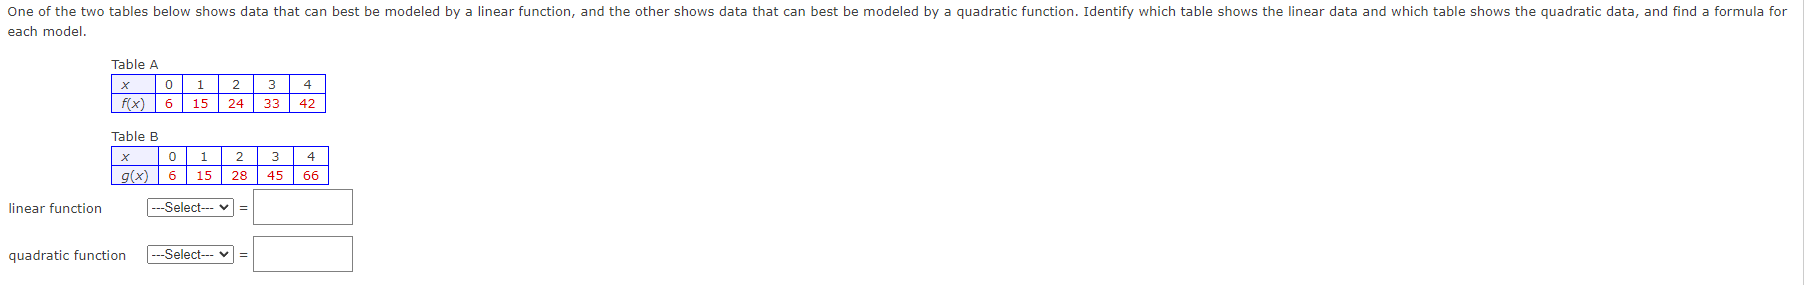
D) I and II onlyOne of the two tables below shows data that can best be modeled by a linear function, and the other shows data that can best be modeled by a quadratic function. Identify which table shows the linear data and which table shows the quadratic data, and find a formula for each model.

One of the two tables below shows data that can best be modeled by a linear function, and the other shows data that can best be modeled by a quadratic function. Identify which table shows the linear data and which table shows the quadratic data, and find a formula for each model.
if -x^2+y^2=4-4x^2y then find the equations of all tangent lines to the curve when y=-5
Find the formula for an exponential function that passes through (0,6) and (2,750)
Use the given conditions to write an equation for the line in point-slope form and general form. Passing through (8,-4) and perpendicular to the line whose equation is
x-6y-5=0
Use the given conditions to write an equation for the line in point-slope form and general form. Passing through (8,-4) and perpendicular to the line whose equation is x-6y-5=0
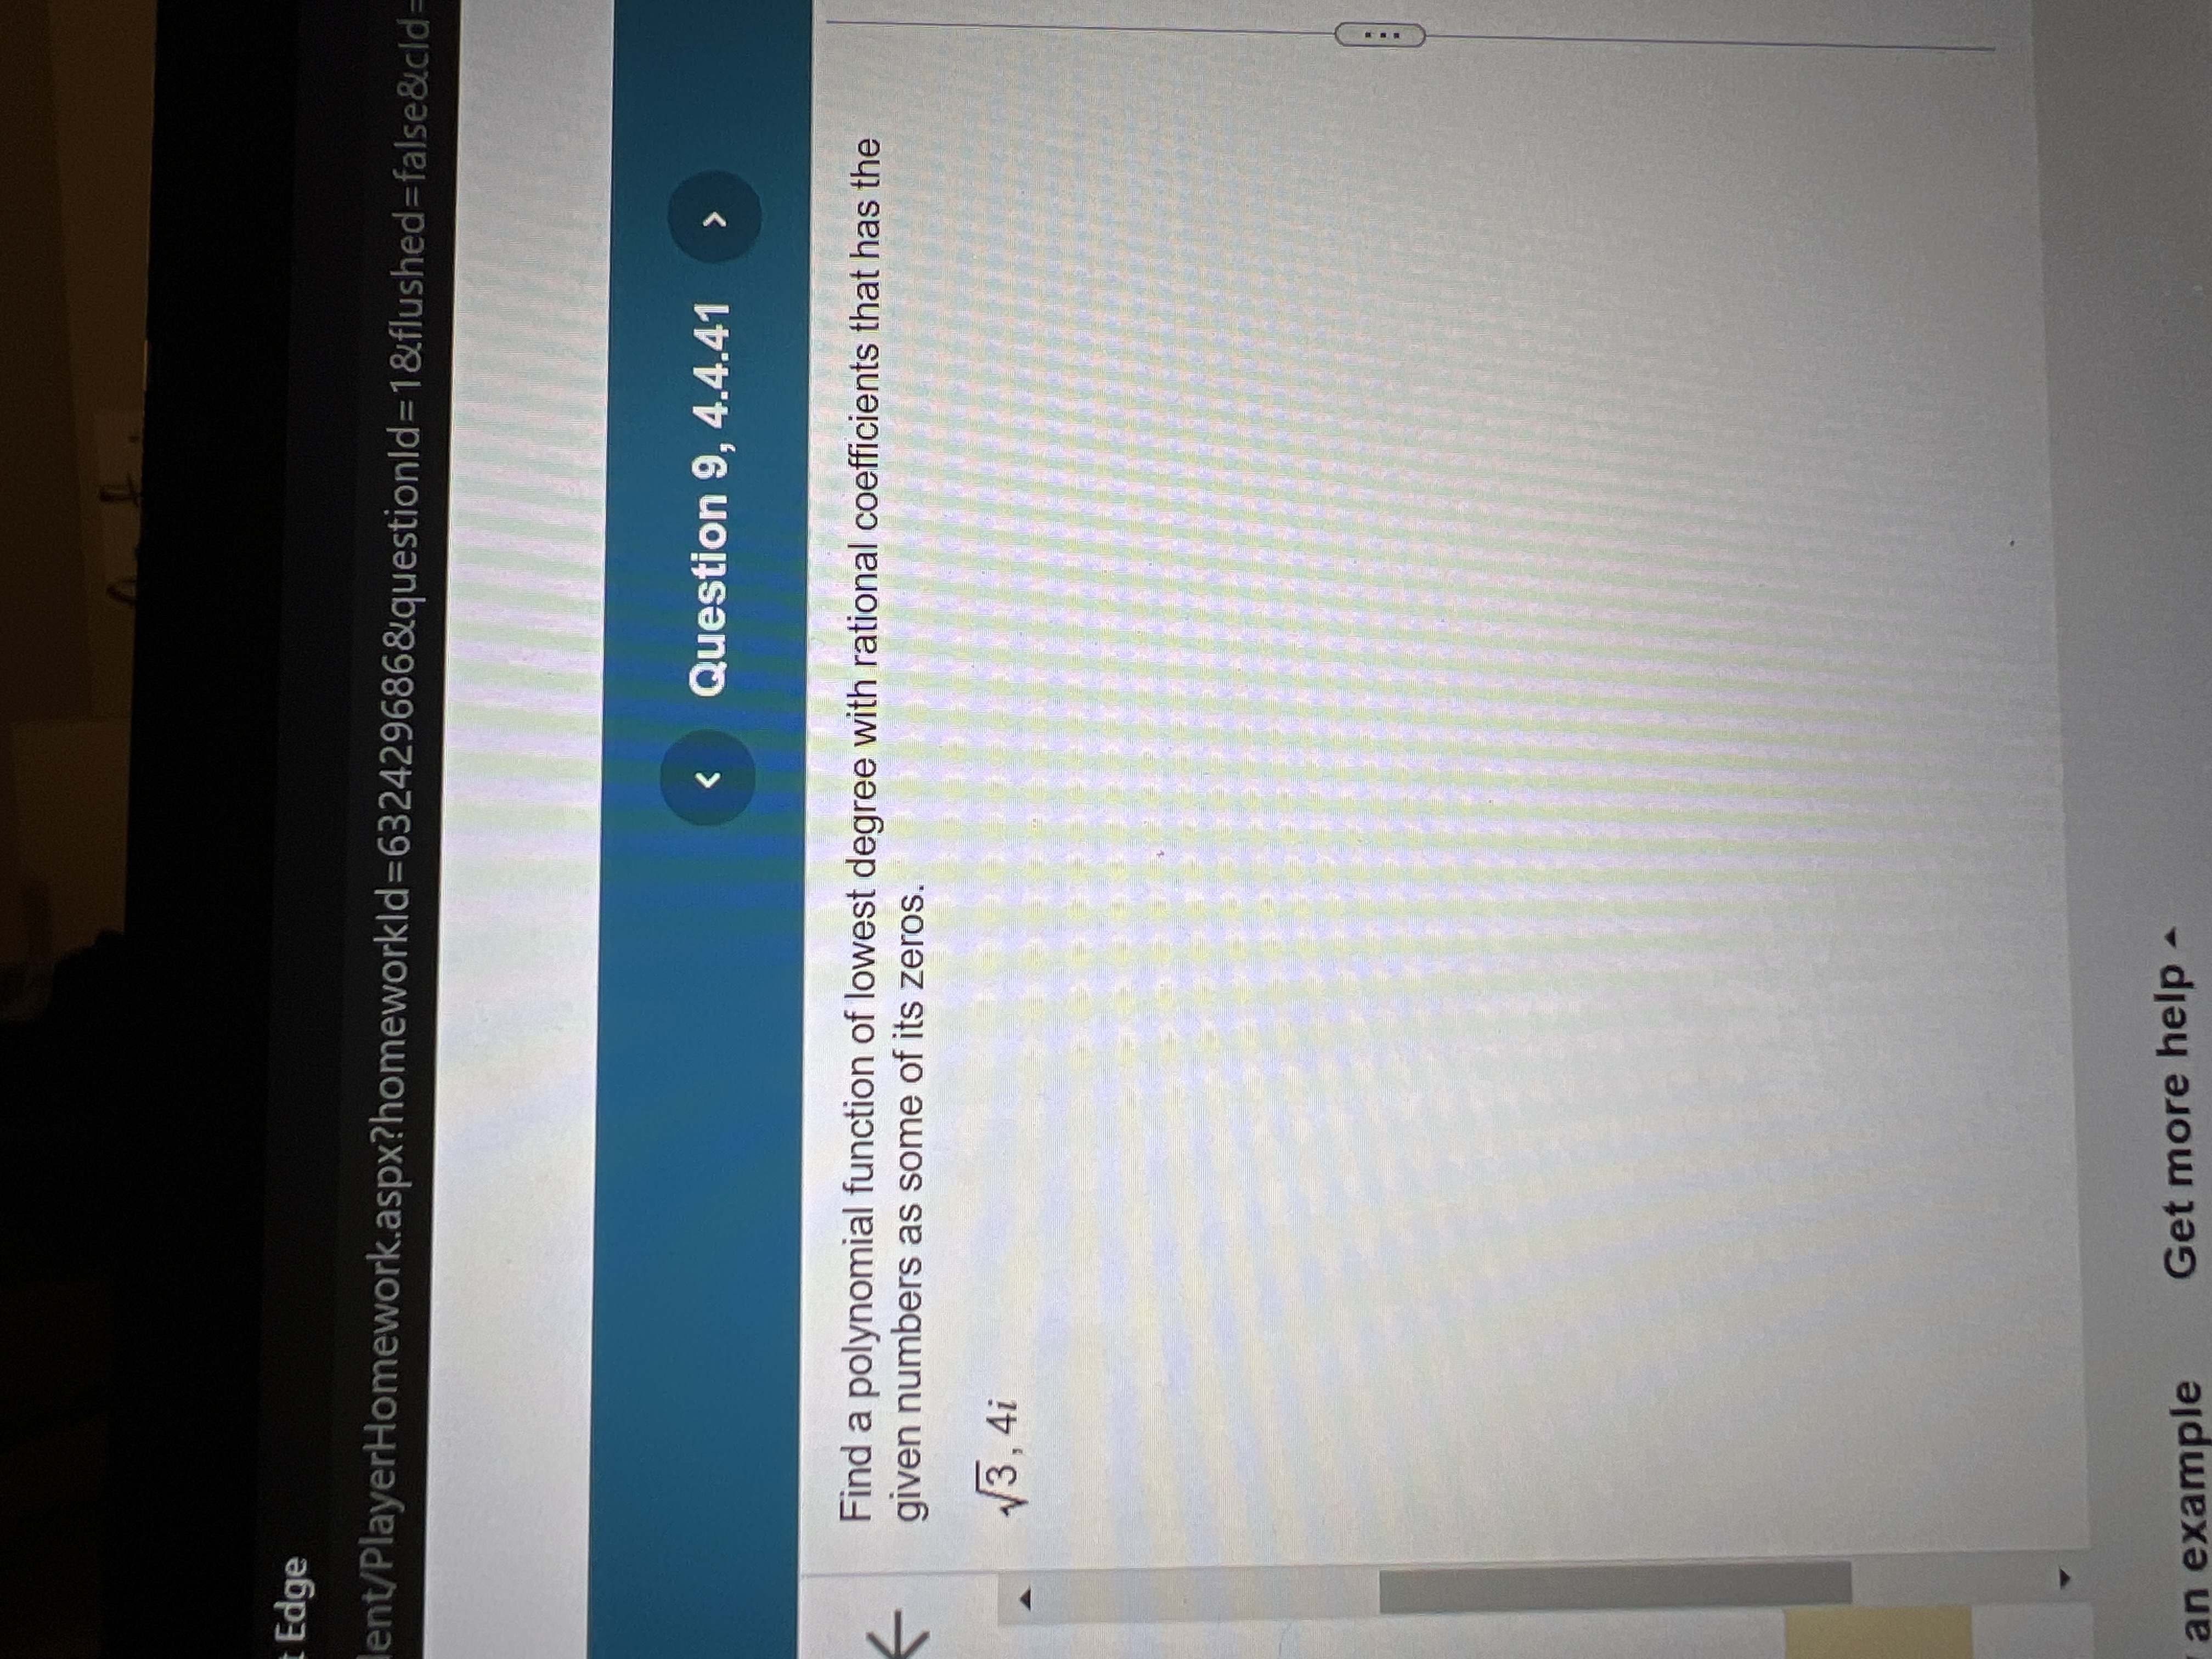
A polynomial of a degree 5 had rational coefficients and the zeros , and
What are the missing zeros?
Let R be the relation on the set {0, 1, 2, 3} containing the ordered pairs (0, 1),(1, 1),(1, 2),(2, 0),(2, 2),(3, 0). Find reflexive, symmetric and transitive closure of R.
A baseball team plays in a stadium that holds 70,000 spectators. With the ticket price at $11, the average attendance has been 29,000. When the price dropped to $10, the average attendance rose to 35,000. Assuming the demand function, p(x), is linear, find p(x), where x is the number of the spectators. Write p(x) in slope-intercept form.
To break even in a manufacturing business, income or revenue R must equal the cost of production the letter C. The cost the letter C to produce X skateboards is the letter C = 108+21X. The skateboards are sold wholesale for $25 each, so revenue the letter R is given by the letter R = 25 X. Find how many skateboards the manufacture needs to produce and sell to break even. (Hint: set the cost expression equal to the revenue expression and solve for X.)